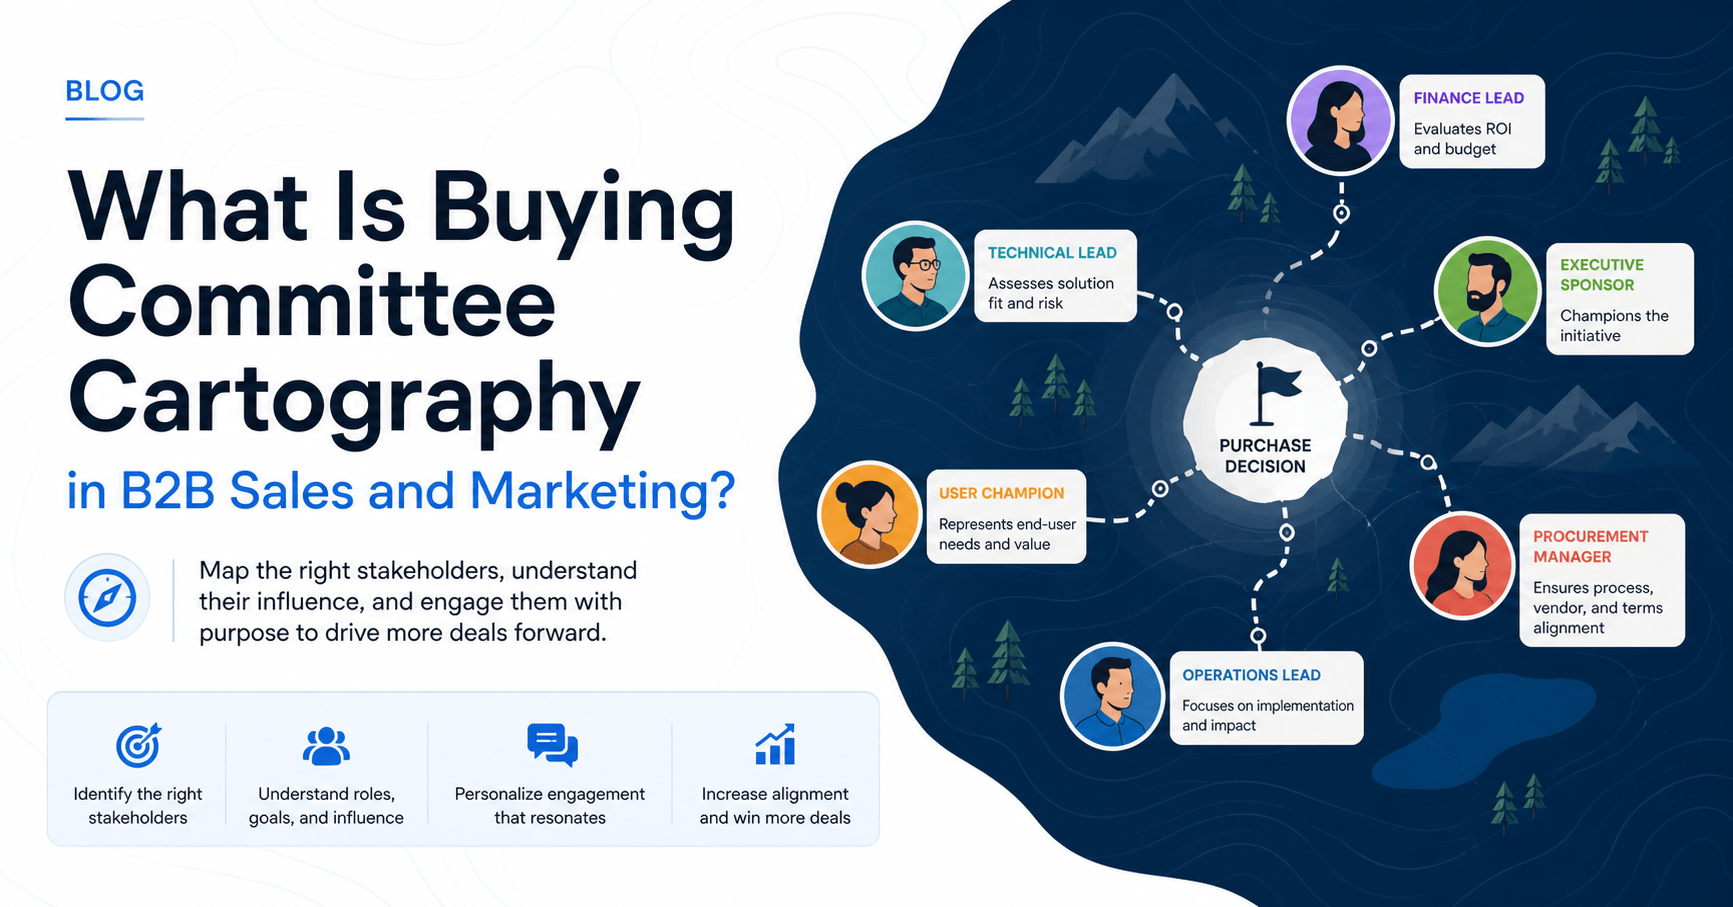
Buying committee cartography is the disciplined practice of mapping every stakeholder, influence path, and engagement state inside a B2B buying group, then re-surveying that map as the deal progresses. The modern B2B purchase involves 13 stakeholders across multiple departments. Cartography replaces ad-hoc buying committee mapping with a repeatable methodology shared by marketing, sales, and customer success.
Key Facts at a Glance
- The average B2B purchase now involves 13 stakeholders, and 89% of buying decisions cross multiple departments. Source: Forrester, The State of Business Buying 2024
- A typical B2B buying committee for a complex solution includes 6 to 10 decision-makers, each arriving with 4 to 5 pieces of independently gathered research. Source: Gartner, The New B2B Buying Journey
- 74% of B2B buyer teams demonstrate unhealthy conflict during the buying decision process. Source: Gartner Sales Survey, May 2025
- 86% of B2B purchases stall at some point in the cycle, and 81% of buyers end up dissatisfied with their chosen vendor. Source: Forrester, The State of Business Buying 2024
- B2B buyers now spend only 17% of their total buying time meeting with potential vendors. Source: Gartner, The B2B Buying Journey
- 79% of IT and software purchases now require CFO final approval. Source: TrustRadius, 2024 B2B Buying Disconnect Report
- 82% of B2B buying decisions are made by groups rather than individuals. Source: Demandbase, B2B Buying Group Research
B2B revenue teams now operate inside a buying environment that has fundamentally outgrown the lead-based playbook. A decade ago, a single contact often signed the contract. Today, the average B2B purchase involves 13 stakeholders distributed across IT, finance, legal, procurement, and the line of business that will actually use the product.
The implication is uncomfortable: any marketing or sales motion built around a single point of contact is structurally undersized for the deal it is trying to win. That is the core reason 86% of B2B purchases stall, and the deeper reason marketing-qualified leads keep failing to convert into revenue.
Buying committee cartography is the response. It is a Fractional CMO discipline that takes “buying committee mapping” beyond a sales worksheet and turns it into a shared, ongoing, marketing-and-sales methodology. This article defines the term, distinguishes it from informal mapping, introduces the Buying Committee Cartography Framework, and walks through how to build, use, and re-survey your first cartography in 2026.
If your B2B revenue function is still optimizing for lead volume instead of committee coverage, schedule a free Fractional CMO consultation with Peter Geisheker to discuss how to install this discipline.
In this article:
- What buying committee cartography is, and why the term matters
- How cartography differs from buying committee mapping, ICPs, and personas
- The 10 stakeholder roles every B2B map should include
- The 5-layer Buying Committee Cartography Framework
- A step-by-step approach to building your first map this quarter
- The most common mistakes B2B teams make
- How cartography connects to ABM, demand generation, and revenue attribution
What Is Buying Committee Cartography?
Buying committee cartography is the methodological practice of surveying, structuring, and continuously updating a visual map of every person who influences a B2B purchase decision inside a target account. The word cartography is deliberate. Cartography, per Merriam-Webster, is the science or art of making maps; informal “mapping” is a verb, but cartography is a discipline with conventions, sources, projections, and update cycles.
In a B2B revenue context, that distinction matters. Most teams already do some form of buying committee mapping; very few do it with the rigor of a discipline. Cartography requires multiple data sources, a standard legend, explicit topography that captures influence flow, and a defined re-survey cadence. The output is a single shared map of the deal that marketing, sales, and customer success can read the same way.
Why Does Buying Committee Cartography Matter for B2B Revenue Teams in 2026?
Buying committee cartography matters because the unit of buying has changed from the individual to the committee, and most B2B go-to-market motions have not caught up. Revenue teams that engage the full committee win at materially higher rates than those still single-threaded on a champion.
The data is unambiguous. Forrester’s 2024 State of Business Buying Report found that the average B2B purchase now involves 13 stakeholders, with 89% of decisions crossing multiple departments. Gartner’s May 2025 sales survey found that 74% of buying teams demonstrate unhealthy conflict during the decision process, and that committees experiencing high relevance to the buying group are three times more likely to report a high-quality deal.
The cost of ignoring committee dynamics shows up everywhere: 86% of purchases stall, 81% of buyers report dissatisfaction with the vendor they ultimately chose, and CEB/Gartner research found that each additional stakeholder added to a buying group reduces purchase likelihood by approximately 25% when the seller has not engaged that stakeholder. Cartography is the operating discipline that closes those gaps.
How Does Buying Committee Cartography Differ From Buying Committee Mapping?
Buying committee cartography differs from buying committee mapping in scope, rigor, and ownership. Mapping is typically a one-time sales activity that lists names and titles inside a deal record. Cartography is a continuous, multi-source, marketing-plus-sales discipline that captures influence, engagement state, and content needs across the full revenue cycle.
The table below contrasts cartography with three adjacent concepts that B2B teams sometimes treat as interchangeable.
| Discipline | Unit of Analysis | Time Horizon | Owner | Output |
|---|---|---|---|---|
| Ideal Customer Profile (ICP) | The target account, in aggregate | Strategic, set annually | Marketing leadership | A firmographic and technographic profile |
| Buyer Persona | A type of person, abstracted | Strategic, set annually | Product marketing | A semi-fictional archetype with goals and pain points |
| Buying Committee Mapping | The named contacts in a single live deal | Tactical, deal-by-deal | Account executive | A list of names and titles in the CRM |
| Buying Committee Cartography | The full committee, plus relationships, influence flow, and engagement state | Continuous, re-surveyed at every stage | Shared by marketing, sales, and customer success | A living map with topography, legend, coverage flags, and content tracks |
Each layer above the previous one. ICPs and personas describe types; mapping captures names; cartography captures the live political and informational terrain of a specific deal. Cartography also outlasts any single deal, because the patterns it surfaces feed back into ABM target lists, demand generation programs, and the company’s overall B2B marketing strategy framework.
What Roles Belong on a B2B Buying Committee Map?
A complete B2B buying committee map includes 8 to 10 distinct stakeholder roles. Not every deal contains every role, and one person may wear multiple hats; the map should still surface the role itself, even when it is unfilled, because unfilled roles are often where deals stall.
The matrix below pairs each role with the concern that defines their evaluation, the marketing content they need, and the buying signal that proves they are engaged.
| Stakeholder Role | Primary Concern | Content That Wins Them | Strongest Buying Signal |
|---|---|---|---|
| Project Sponsor | Why now, business case | Diagnostic content, market trend reports | First inbound touch, problem-stage queries |
| Champion | Career impact, internal credibility | Sharable executive briefs, peer case studies | Forwarding emails internally, scheduling meetings |
| Economic Buyer | ROI, payback period, total cost | TCO models, ROI calculators, board-ready slides | Asking for pricing detail, requesting references |
| Technical Buyer | Architecture, security, scalability | Reference architecture, SOC 2 docs, integration specs | Requesting POC, technical deep-dive sessions |
| End User | Daily usability, training, adoption | Workflow demos, training videos, peer reviews | Repeated product trial use, peer-review research |
| Operations Owner | Implementation, change management | Onboarding plans, success milestones, services scope | Requesting implementation timeline |
| Legal Reviewer | Contract terms, risk exposure | MSA templates, DPA, privacy posture | Redlines on contract draft |
| Compliance / Security | Audit posture, data handling | Security questionnaires, penetration test reports | Sending vendor security assessment |
| Procurement | Pricing leverage, vendor consolidation | Pricing comparison, supplier diversity docs | Issuing RFP, formal vendor onboarding |
| Executive Sponsor / Final Authority | Strategic alignment, signature | Strategic narrative, exec-to-exec briefings | Final review meeting, contract sign |
Mapping these roles is not an academic exercise. Each role corresponds to a different content track and a different bottleneck. Influ2’s 2026 enterprise buying survey found that the top three deal blockers are budget approval (34%), internal alignment (22%), and security review (20%); each maps directly to a role most marketing programs systematically under-reach.
The Buying Committee Cartography Framework
The Buying Committee Cartography Framework is a five-layer methodology developed to operationalize cartography across marketing and sales. The five layers mirror the elements of any usable real-world map: a survey, a topography, a legend, a coverage view, and a re-survey cadence.
Layer 1: Survey
Every map starts with data. The Survey layer pulls stakeholder data from at least four sources rather than relying on whichever names happened to fill out a form. Sources include the CRM (Opportunity Contact Roles), conversation intelligence platforms (Gong, Chorus, Clari Copilot), intent data (6sense, Bombora, Demandbase), and direct sales conversations with the champion. Marketing automation engagement data adds a fifth signal that surfaces stakeholders who are researching anonymously.
The Survey layer also captures one piece of information most teams skip: the source of each entry. Knowing whether a stakeholder was named by the champion, inferred from intent data, or self-identified through a content download tells you how reliable that data point is. A surveyed stakeholder is a sourced stakeholder.
Layer 2: Topography
The Topography layer captures the political terrain of the committee, not the org chart. It records reporting lines, peer relationships, where two stakeholders historically conflict, and which informal influencers shape the formal decision-makers. Topography distinguishes the person who signs from the person who decides, and the person who decides from the person who can quietly veto.
A clean topography is what allows multithreading to work. Without it, a sales team adding contacts to a deal is just adding noise. With it, every additional thread is targeted at a specific gap in the influence flow.
Layer 3: Legend
The Legend layer is the standardized vocabulary the entire revenue team uses to describe the committee. It is the most under-built layer in most B2B organizations, which is why the same person ends up classified as “champion” by the AE, “influencer” by the ABM team, and “primary contact” by marketing. The Legend forces a single shared definition of every role, every engagement state, and every signal type.
A useful Legend covers role definitions, engagement states (engaged, dark, blocked, missing), signal types (intent, content engagement, sales conversation, peer reference), and influence levels (decider, recommender, informer, blocker). Once the Legend is shared, the rest of the cartography becomes interpretable across functions.
Layer 4: Coverage
The Coverage layer overlays the current engagement state onto the topography. Each stakeholder is flagged as Engaged (active, two-way contact), Dark (in the committee, no engagement), Blocked (engaged but unfavorable), or Missing (the role exists but no person has been identified). Coverage is the layer that turns a static org chart into an actionable deal map.
Coverage is also what marketing operates against. ABM platforms can build audiences specifically for Dark and Missing stakeholders, deploying contact-level ads to surface those people before they become deal blockers. The Coverage view is the dashboard that tells marketing where to spend its next dollar.
Layer 5: Re-survey
The Re-survey layer is the cadence at which the map is updated. Buying committees shift constantly: champions get promoted away, new compliance reviewers are added when AI governance becomes a board topic, procurement gets pulled in late, executive sponsors switch jobs. A map surveyed once and never updated becomes wrong in weeks.
The default cadence is a full re-survey at every formal stage gate (Discovery, Solution Validation, Business Case, Negotiation, Close), plus a coverage update inside the weekly deal review. The cadence is non-negotiable because the consequence of skipping it is the exact failure mode that makes 86% of B2B purchases stall.
How Do You Build Your First Buying Committee Cartography?
You build your first buying committee cartography in four steps, working on a small set of live deals before rolling the practice out organization-wide. The goal of the first build is not perfection; it is establishing the discipline.
Step one is to pick three to five live, high-value opportunities that each represent a different deal archetype (new logo, expansion, competitive displacement). Step two is to populate the Survey layer for each: pull every contact from the CRM, every name mentioned in conversation intelligence transcripts, and every intent signal from your ABM platform.
Step three is to draft the Topography and Legend with the AE, the marketing ABM lead, and a customer success representative in the same working session. Step four is to assign Coverage flags and set the Re-survey cadence inside the existing weekly deal review. The first cartography exists in a shared document; the production version eventually lives inside Salesforce, the ABM platform, or a dedicated tool like Traction Complete.
If the work above sits on no one’s desk because sales and marketing alignment has not been built first, fix that gap before attempting cartography. Cartography is a downstream discipline; it requires shared accountability between marketing and sales as a prerequisite.
What Are the Most Common Mistakes in Buying Committee Cartography?
The most common mistakes in buying committee cartography are over-reliance on the champion as a single source, conflating personas with cartography, ignoring missing roles, and treating the map as a static artifact instead of a living document.
Champion-only cartography is the single biggest failure mode. Every champion sees the committee from their own seat; they often understate procurement involvement, miss compliance reviewers, and underestimate executive sponsor scrutiny. Cartography that draws only from the champion is closer to a wish list than a map.
The second mistake is using a buyer persona as if it were a cartography. Personas describe types of people; cartography describes specific people in a specific deal. Personas inform the content tracks behind cartography; they do not replace the named, sourced, coverage-flagged map of who is actually in the room.
The third mistake is ignoring missing roles. If your map has no procurement contact and the deal is north of $100,000, procurement is not absent from the deal; it is invisible to you. Missing roles are deal risks, not data gaps.
The fourth mistake is letting the map go stale. A cartography updated once at qualification is wrong by the time the deal reaches negotiation. Re-survey cadence is what separates cartography from mapping.
How Does Buying Committee Cartography Connect to ABM and Demand Generation?
Buying committee cartography is the operating layer that makes account-based marketing and demand generation actually work in committee-driven deals. ABM without cartography reaches accounts but not committees; demand generation without cartography fills the funnel with leads who have no path to a contract.
In an ABM program, cartography is what turns “100 target accounts” into “847 specific stakeholders across 100 accounts,” each with a defined role, engagement state, and content track. Marketing campaigns are then built against committee gaps rather than account names. The audiences for next quarter’s LinkedIn ads, contact-level display, and event invitations come directly from the Coverage layer of the cartography.
In demand generation, cartography is what turns lead capture into committee assembly. A single MQL is a doorway, not a deal; the moment the first contact converts, cartography begins, and marketing’s job shifts from generating one more lead to surfacing the other 12 stakeholders the deal will eventually need. This shift is at the core of the B2B demand generation strategy Fractional CMOs install in companies that have plateaued at MQL-volume thinking. It also reframes lead qualification frameworks like BANT for the buying-committee era.
Frequently Asked Questions
What is buying committee cartography in B2B sales and marketing?
Buying committee cartography is the disciplined practice of mapping every stakeholder, influence path, and engagement state inside a B2B buying group, then re-surveying that map as the deal progresses. It elevates informal “buying committee mapping” into a shared marketing-plus-sales methodology with a defined survey, topography, legend, coverage view, and re-survey cadence. Cartography is the operating layer that makes ABM, demand generation, and multithreading actually work in deals where 6 to 13 stakeholders need to align before anyone signs.
How is buying committee cartography different from buying committee mapping?
Buying committee mapping is typically a one-time sales activity that lists named contacts inside a deal record. Buying committee cartography is a continuous, multi-source, marketing-plus-sales discipline that captures relationships, influence flows, engagement states, and content needs across the full revenue cycle. Mapping answers “who is in the deal.” Cartography answers “who is in the deal, who do they influence, what state are we in with each of them, and how must our content and outreach change at the next stage?” Mapping is a snapshot. Cartography is a living document.
How many people are on a typical B2B buying committee?
A typical B2B buying committee includes 6 to 10 decision-makers for complex enterprise solutions, with the average B2B purchase now involving 13 stakeholders across multiple departments, according to Gartner and Forrester’s 2024 State of Business Buying Report. Mid-market deals typically involve 3 to 6 stakeholders, while enterprise deals frequently span 11 to 20 people across IT, finance, legal, procurement, and the business unit. Bain research describes this as a three-tier structure: ultimate approvers, the core buying committee, and internal influencers, usually end users, with each tier requiring different content and engagement.
What is the difference between a buying committee map and an Ideal Customer Profile?
An Ideal Customer Profile (ICP) describes the type of company you want to sell to, defined by firmographic and technographic attributes. A buying committee cartography describes the specific people inside a specific account who will collectively make a purchase decision. ICPs are set strategically and revisited annually. Cartographies are built per opportunity and re-surveyed every stage. Both are needed: ICP tells you which doors to walk through; cartography tells you who is in the room once you are inside.
Who should own buying committee cartography in a B2B company?
Buying committee cartography is co-owned by marketing and sales, with operational ownership often sitting with revenue operations or an ABM lead. The Account Executive owns deal-specific accuracy. Marketing owns role-based content tracks and Coverage-driven audience targeting. Customer success contributes during expansion deals where the committee mostly already exists. A Fractional CMO is often the right person to install the discipline initially because cartography sits at the intersection of marketing strategy, sales process, and revenue operations; if no single executive owns that intersection, the work tends not to happen.
What tools support buying committee cartography?
Buying committee cartography is most often supported by Salesforce Opportunity Contact Roles for the foundational record, an ABM platform like 6sense or Demandbase for intent and committee coverage, and a relationship intelligence layer like Affinity for influence mapping. Conversation intelligence tools such as Gong or Chorus surface stakeholders mentioned but not yet entered. Sales execution platforms (Outreach, Salesloft) operationalize the multithreading. Dedicated buying committee mapping tools like Traction Complete and Influ2 are emerging specifically for this use case. The right stack is whatever lets you maintain Survey, Topography, Legend, Coverage, and Re-survey inside your existing CRM.
Why do B2B deals stall, and how does cartography help?
B2B deals stall because at least one stakeholder’s concerns were never surfaced, never addressed, or never even identified by the seller. According to Forrester’s 2024 research, 86% of B2B purchases stall at some point in the cycle, and Gartner’s May 2025 sales survey found that 74% of buying teams demonstrate unhealthy conflict during the decision process. Buying committee cartography reduces stalls in two specific ways. First, the Coverage layer flags Dark and Missing stakeholders before they become blockers. Second, the Re-survey cadence catches new stakeholders the moment they enter the committee, instead of letting them surface mid-negotiation as a surprise.
How does buying committee cartography fit with multithreading in B2B sales?
Multithreading is the sales tactic of building relationships with multiple committee members simultaneously rather than relying on a single point of contact. Buying committee cartography is the system that tells multithreading where to thread, with what message, and at what stage. Multithreading without cartography is just adding contacts; it tends to feel intrusive to the buyer and chaotic to the seller. With cartography, every additional thread is aimed at a specific Coverage gap with a role-appropriate piece of content, and the deal team can answer the most important multithreading question: which thread to add next, and why.
From Buying Committee Cartography to Revenue Outcomes
Buying committee cartography is not a tool, a template, or a checkbox in a CRM. It is the operating discipline that makes every other modern B2B revenue practice work as intended. ABM works because cartography defines the committees inside the target accounts. Demand generation works because cartography turns the next MQL into the start of a 13-stakeholder coverage problem instead of the end of a lead-generation report. Multithreading works because cartography tells the seller which thread to add next.
The shift from mapping to cartography is the same shift B2B revenue teams have to make from selling to individuals to enabling committees. The data is unambiguous: when companies install a real cartography discipline, win rates rise, stalled-deal counts fall, and forecasting accuracy improves quarter over quarter. The companies still running 2017 motions in a 2026 buying environment will keep losing 86% of their pipeline to the silent failures cartography is designed to catch.
If your B2B revenue function is producing leads but not committee coverage, the highest-leverage operational change available is installing buying committee cartography as a shared marketing-and-sales practice. Schedule a free Fractional CMO consultation with Peter Geisheker to discuss how to install The Buying Committee Cartography Framework inside your specific B2B revenue motion, or review how it integrates with full Fractional CMO services at The Geisheker Group.
About Peter Geisheker
Peter Geisheker is the Founder and CEO of The Geisheker Group, Inc., a Fractional CMO and B2B marketing advisory serving CEOs and investor-backed companies. He specializes in scalable, capital-efficient revenue systems across B2B SaaS, B2B services, and performance-driven environments, with AI embedded across all engagements. His work includes programs delivering 6X inbound lead growth, 100% YoY SaaS revenue growth for three consecutive years, and a 77% reduction in paid acquisition spend while growing revenue.
Ready to explore how a Fractional CMO can install buying committee cartography in your revenue function? Schedule a free consultation with Peter.
References and Sources
- Forrester, The State of Business Buying 2024: average 13 stakeholders, 89% cross-departmental, 86% stall, 81% buyer dissatisfaction. https://www.forrester.com/blogs/the-state-of-b2b-buying-2024-from-self-service-to-self-serve/
- Gartner, The New B2B Buying Journey: 6-10 stakeholders typical, 4-5 pieces of independent research per stakeholder, 17% of buyer time spent with vendors. https://www.gartner.com/en/sales/insights/b2b-buying-journey
- Gartner Sales Survey, May 2025: 74% of B2B buyer teams demonstrate unhealthy conflict during the buying decision process; buying-group-relevant content 3x more likely to drive high-quality deal. https://www.gartner.com/en/newsroom/press-releases/2025-05-07-gartner-sales-survey-finds-74-percent-of-b2b-buyer-teams-demonstrate-unhealthy-conflict-during-the-decision-process
- Gartner Sales Survey, June 2025: 61% of B2B buyers prefer a rep-free buying experience; 73% avoid suppliers sending irrelevant outreach. https://www.gartner.com/en/newsroom/press-releases/2025-06-25-gartner-sales-survey-finds-61-percent-of-b2b-buyers-prefer-a-rep-free-buying-experience
- TrustRadius, 2024 B2B Buying Disconnect Report: 79% of IT/software purchases require CFO final approval; 52% of buying groups now include VP+ decision-makers. https://www.trustradius.com/buyer-blog/b2b-buying-disconnect-2024
- Demandbase, B2B Buying Group Research, 2025: 82% of B2B buying decisions made by groups; 72% of purchases involve high-complexity buying groups; 10 unique decision-maker functions. https://www.demandbase.com/resources/research/
- Influ2, 2026 Enterprise Buying Survey: top deal blockers: budget approval (34%), internal alignment (22%), security review (20%). https://www.influ2.com/academy/buying-committees
- Traction Complete, Mapping the B2B Buying Committee: 10-role buying committee model. https://tractioncomplete.com/articles/mapping-the-b2b-buying-committee/
- CEB / Gartner, The Challenger Customer (Adamson, Dixon, Spenner, Toman): each additional stakeholder reduces purchase likelihood by approximately 25%. Penguin, 2015.
- Bain & Company, B2B Buying Behavior Research: three-tier buying committee structure (ultimate approvers, core committee, internal influencers). https://www.bain.com/insights/topics/b2b-go-to-market/
- SiriusDecisions / Forrester: B2B companies with tightly aligned sales and marketing achieve 24% faster three-year revenue growth and 27% faster three-year profit growth. (Cited in The Geisheker Group, Sales and Marketing Alignment.)
- Merriam-Webster, definition of cartography. https://www.merriam-webster.com/dictionary/cartography