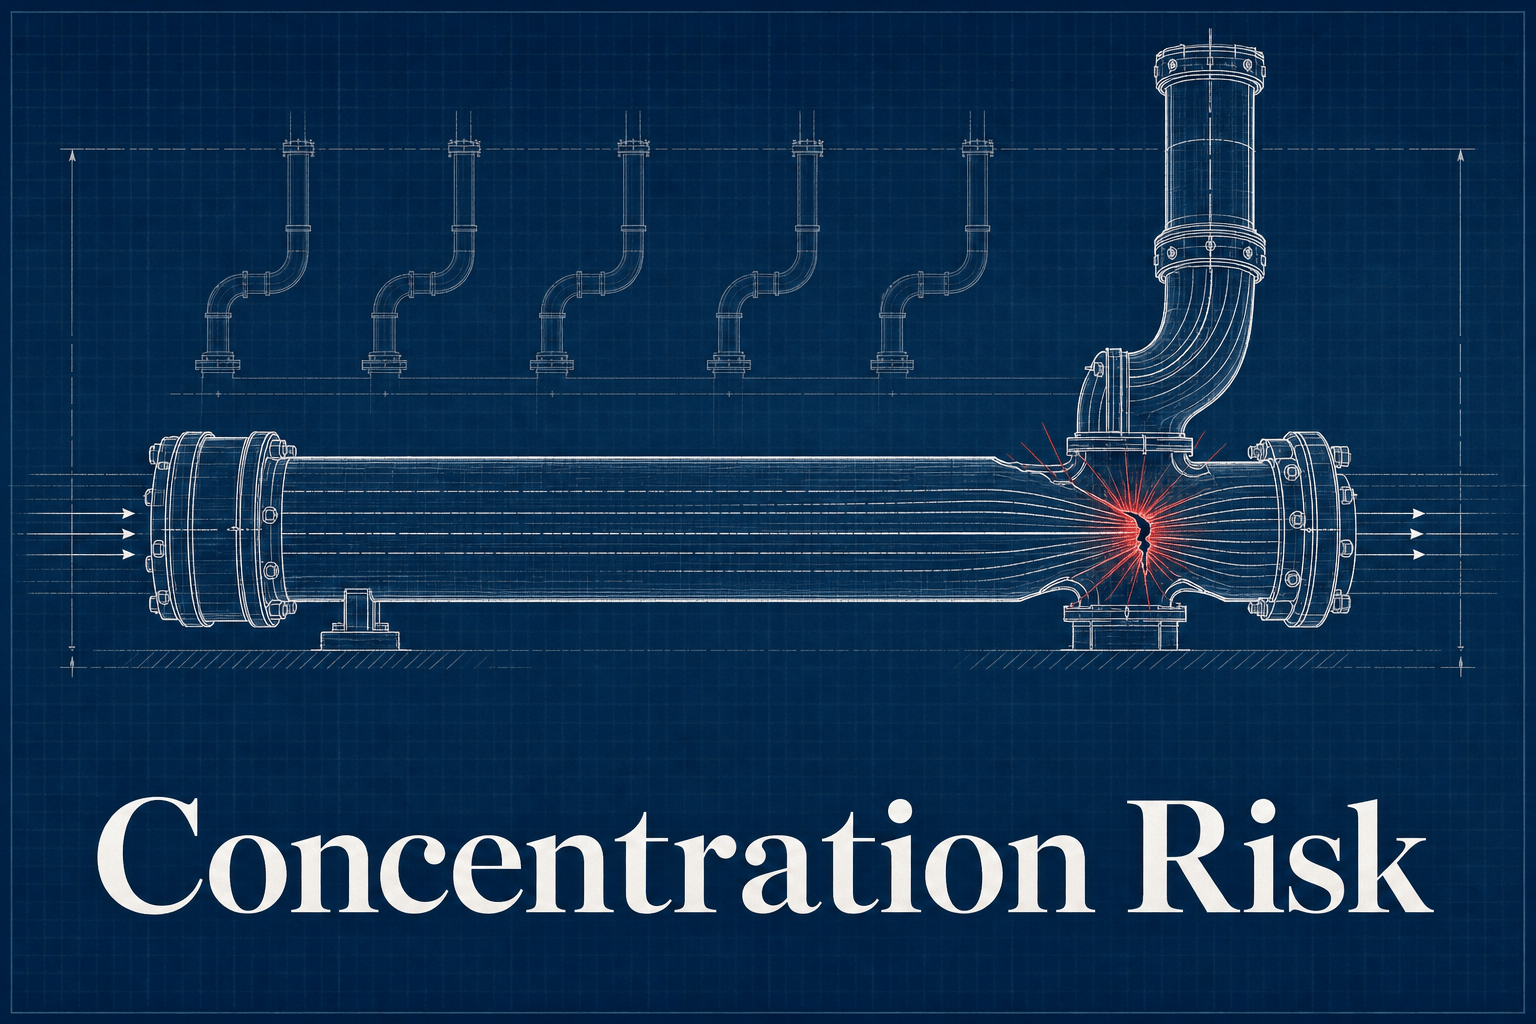
Bottom line: Demand-engine concentration risk is the exposure created when a portfolio company’s new revenue depends on a single channel, a single salesperson, a single customer relationship, or the founder’s personal network, so that pipeline collapses if that one dependency is removed. Buyers already price customer concentration; a single customer above 30 percent of revenue can trigger a 20 to 35 percent valuation discount. What almost nobody prices is the concentration sitting upstream, in how the company acquires customers at all. That is unpriced risk, and in 2026 it is repricing itself whether or not anyone is watching.
Peter Geisheker has run this failure on his own property, which is the cheapest place to learn it:
“I built a content engine and pointed it at one of my own properties. Tens of thousands of impressions. Almost no leads. Not because I reached the wrong people, but because AI summaries answered the question on the results page and nobody needed to visit the site.”
The engine was not broken and the content was not bad. The click-through model it was built for is what stopped existing. That is platform concentration, and it does not appear on any financial statement.
Key Facts at a Glance
- A single customer above 20 percent of revenue triggers detailed buyer review, and above 30 percent some buyers decline the process entirely; the valuation discount ranges from 20 to 35 percent (FOCUS Investment Banking, 2025).
- Founder-dependent businesses receive valuations 30 to 50 percent below comparable owner-independent companies, and achieve 3X to 4X EBITDA at exit against 7X to 8X for lower-middle-market peers that do not depend on one person (Strategic Exit Advisors, 2026).
- Significant key-person dependency typically costs 0.5X to 1.5X of multiple, plus longer earnouts, larger escrows, and retention packages (LegacyVector M&A glossary, 2026).
- AI Overviews reduced the organic click-through rate for the top-ranking page by 58 percent between December 2023 and December 2025 (Ahrefs, 300,000-keyword study, December 2025).
- Companies relying primarily on paid channels saw customer acquisition cost rise about twice as fast as companies with diversified channel mixes (Forrester Research, reported by GrowSurf).
- Private equity deals now require roughly 10 to 12 percent annual EBITDA growth to hit a benchmark 2.5X return, against about 5 percent in the 2010s (Bain & Company, Global Private Equity Report 2026).
- Assets sold in 2024 and 2025 had median revenue growth two to three percentage points higher than assets still sitting in portfolios (McKinsey & Company, 2026, citing Gain.pro data).
This guide draws on Peter Geisheker’s 20-plus years of B2B marketing experience as founder of The Geisheker Group, Inc., a fractional CMO agency serving B2B, B2B SaaS, PE/VC-backed, and law firm clients. Documented client outcomes include 6X inbound lead growth, 100% YoY SaaS revenue growth for three consecutive years, 77% reduction in paid acquisition spend while growing revenue, and $1 million per week in managed ad spend for law firm lead generation. The framework below is built from 2026 benchmark data published by Bain, McKinsey, Ahrefs, Pew Research, and Forrester, together with the M&A valuation sources cited throughout, and from what Peter Geisheker has observed running demand engines for B2B companies, including on his own properties.
Contents
- What is demand-engine concentration risk?
- Why does concentration risk matter more in 2026 than it did five years ago?
- What are the five forms of demand-engine concentration?
- Where are the red-flag thresholds, and how do buyers price them?
- Which concentration risks hide from the financials entirely?
- What is the fastest way to reduce concentration risk during the hold?
- When is concentration not a red flag?
- Frequently asked questions
Need marketing leadership and expert strategy to grow your company?
Peter Geisheker embeds as your fractional CMO, diversifies the demand engine, and owns the number. Senior B2B marketing leadership, available in days, without a full-time hire on the payroll.
Explore Fractional CMO Services
Engaging a fractional CMO agency gives a portfolio company senior marketing leadership without adding permanent overhead to the EBITDA line.
What is demand-engine concentration risk?
Commercial due diligence is good at customer concentration. It counts the top ten accounts, divides by revenue, and flags anything ugly. That work is well established, and buyers price it reliably.
The blind spot is one level upstream. Customer concentration describes the revenue base you already have. Demand-engine concentration describes how new revenue arrives, and it is a different question with a different answer. A company can have a beautifully diversified customer list where no account exceeds 6 percent of revenue, and still have a demand engine in which 80 percent of new pipeline comes from one channel, one salesperson, or one referral partner. The balance sheet looks safe. The growth engine is a single point of failure.
This is the B2B version of rainmaker dependence, and it is priced the same way once a buyer finds it. Key-person dependency typically costs 0.5X to 1.5X of multiple, along with longer earnouts, larger escrows, and retention packages for the people the buyer is actually purchasing (LegacyVector, 2026). Founder-dependent businesses in the lower middle market achieve 3X to 4X EBITDA where owner-independent peers achieve 7X to 8X, a gap of 30 to 50 percent against comparables (Strategic Exit Advisors, 2026). Appraisers formalize the same judgment: when a business cannot function without its owner, the company-specific risk premium in the discount rate rises by 2 to 10 percentage points (Sofer Advisors, 2026).
The reason this risk goes unpriced is procedural, not intellectual. Nobody owns it. The deal team runs financial and commercial diligence. The operating team runs the value-creation plan. The demand engine sits between the two, and no standard workstream is assigned to open it up. So the risk survives to the exit table, where it is finally priced by the buyer instead of the seller.
Why does concentration risk matter more in 2026 than it did five years ago?
Because the margin for error has collapsed, and because one of the most common concentrations just repriced itself violently.
Start with the deal math. Bain’s 2026 framing is that “12 is the new 5”: in the 2010s a typical buyout needed roughly 5 percent annual EBITDA growth to produce a 2.5X multiple on invested capital, and today, with no multiple expansion to lean on, the same deal requires roughly 10 to 12 percent (Bain & Company, Global Private Equity Report 2026). McKinsey arrives at the same place from the other side: leverage and multiple expansion accounted for 59 percent of buyout returns between 2010 and 2022, and that engine is gone (McKinsey & Company, Global Private Markets Report 2026). Median entry multiples hit 11.8 times EBITDA in 2025, and the typical portfolio company is now held for an average of 6.6 years, with more than 16,000 companies globally held past four years, or 52 percent of total buyout-backed inventory (McKinsey & Company, 2026).
Read those numbers together and the implication is uncomfortable. You paid a record multiple. You need double-digit EBITDA growth. You will hold the asset for the better part of seven years. And the entire growth thesis rests on a demand engine nobody stress-tested.
Now the repricing. Consider a portfolio company whose pipeline came predominantly from Google organic search, a channel that looked free, defensible, and compounding when the deal was underwritten. Ahrefs measured position-one organic click-through rate for AI Overview keywords falling from 7.6 percent to 1.6 percent between December 2023 and December 2025, a 58 percent reduction attributable to AI Overviews (Ahrefs, 300,000-keyword study, 2025). Seer Interactive, analyzing 25.1 million impressions across 42 organizations, measured organic click-through rate falling 61 percent, from 1.76 percent to 0.61 percent, when an AI Overview appeared. Pew Research, tracking 68,879 real searches, found users clicked a result only 8 percent of the time when an AI summary was present, against 15 percent without, and clicked a link inside the summary itself roughly 1 percent of the time.
Nothing that company did caused this. Its rankings may not have moved at all. The channel simply stopped delivering clicks, and if that channel was 70 percent of the demand engine, the value-creation plan broke without a single line item changing. That is what concentration risk actually feels like when it triggers, and it is why the question belongs in diligence rather than in a post-mortem. The mechanics of testing for it before close are covered in marketing due diligence.
What are the five forms of demand-engine concentration?
Concentration risk is not one thing. It is five, and they carry different diligence tests and different remedies.
What a diversified demand engine actually produces
6X inbound lead growth. A 77% reduction in paid acquisition spend while revenue grew. $1 million per week in managed ad spend. Peter Geisheker builds demand engines that do not rest on one channel, one platform, or one person.
| Form of concentration | What it looks like | The diligence question to ask | How it gets priced |
|---|---|---|---|
| 1. Customer concentration | One account, or a top-five cluster, carries an outsized share of revenue | What percentage of revenue comes from the top one, five, and ten customers, and is it contracted or informal? | 20% to 35% valuation discount above the 30% threshold; holdbacks and earnouts |
| 2. Channel concentration | Most new pipeline arrives through one route: organic search, paid search, outbound, events, or partner referral | What share of new pipeline did each channel source in the last four quarters, and what happens to the plan if the largest one halves? | Rarely priced explicitly; shows up later as a missed growth plan |
| 3. Platform concentration | Inside a channel, one platform owns the demand: Google, Meta, LinkedIn, Amazon, one marketplace, one referral partner | Which single company can change a policy or an algorithm and remove this pipeline without asking us? | Almost never priced; the AI Overviews repricing is the live example |
| 4. Person concentration | The founder, one rainmaker, or one salesperson sources most new business through personal relationships | If this person left in 90 days, how much of next year’s pipeline leaves with them? | 0.5X to 1.5X of multiple; 30% to 50% discount in severe founder dependence |
| 5. Segment concentration | One vertical, one geography, or one use case produces nearly all demand | Is the growth thesis a bet on one end market’s capex cycle, and do we know what that cycle is doing? | Priced as market risk if the buyer notices; usually not attributed to marketing |
Only the first of these five is reliably priced today. That is the arbitrage. A firm that runs the other four questions in diligence is buying with better information than the seller has, and a firm that fixes them during the hold is manufacturing multiple rather than hoping for it.


Get a portfolio growth plan from two senior CMOs
30 minutes with both of us. No hard sell. Written plan in 3 business days.
Where are the red-flag thresholds, and how do buyers price them?
For customer concentration, the lower-middle-market conventions are reasonably settled: any single customer above 10 percent of revenue is noted, above 20 percent is treated as material concentration, and above 30 percent typically triggers significant discounting or a change in deal structure, while a top-five cluster above 70 percent is considered elevated (KitsWest Capital, 2026). FOCUS Investment Banking’s analysis puts the discount at 20 to 35 percent once a single customer passes 30 percent of revenue, with some buyers declining the process outright at that level (FOCUS Investment Banking, 2025).
Buyers do not usually express the risk as a lower headline number. They express it three ways at once: a reduced multiple, a larger portion of the price moved into an earnout tied to retention, and an escrow held against the loss of the concentrated account. Sellers frequently discover that the deal they signed pays out 50 to 60 percent at close and puts the rest at risk.
For the four demand-side concentrations, there is no market convention. None. No published benchmark exists for how much channel concentration is too much, and any advisor who hands you a tidy green-amber-red table of pipeline thresholds is inventing the numbers, because there is no dataset to draw them from.
That absence is the finding, not a gap in this article. It is precisely why these risks go unpriced: buyers discount what they can benchmark, and they stay silent about what they cannot. Here is the honest state of the market.
| Form of concentration | Is there a market convention? | What buyers actually do |
|---|---|---|
| Customer | Yes. Above 10% of revenue is noted, above 20% is material, above 30% triggers discounting or restructured terms; a top-five cluster above 70% is elevated (KitsWest Capital, 2026) | Cut the multiple by 20% to 35%, move price into an earnout, hold an escrow; some decline the process outright (FOCUS Investment Banking, 2025) |
| Person | Partly. Key-person dependency costs 0.5X to 1.5X of multiple (LegacyVector, 2026); severe founder dependence runs 30% to 50% below comparables (Strategic Exit Advisors, 2026) | Longer earnouts, larger escrows, retention packages, mandatory transition agreements; appraisers add 2 to 10 points to the company-specific risk premium (Sofer Advisors, 2026) |
| Channel | No. No published threshold exists | Nothing. It is not a standard diligence workstream |
| Platform | No. No published threshold exists | Nothing, even though this is the risk that repriced hardest in 2025 and 2026 |
| Segment | No. Treated as end-market risk when it is treated at all | Priced as market exposure, rarely attributed to the demand engine |
Two of five are priced. Three are not. That asymmetry is the entire opportunity, and it exists because the priced ones are legible in a data room and the unpriced ones are not.
What to use instead of a threshold. Since no benchmark exists, the useful question is not “what percentage is too much.” It is fragility, and fragility has two inputs: how much of the pipeline depends on the single point, and how much control you have over it. A channel at 60 percent of pipeline that you own outright, with your own list and your own economics, is a stronger position than a channel at 40 percent controlled by a platform that can change its algorithm this quarter without telling you. Size alone tells you almost nothing. Size multiplied by the absence of control tells you where the company will break.
What can be measured without inventing anything: pipeline sourced by channel, by platform, by person, and by segment, over at least four trailing quarters, alongside CAC for each. That data almost never exists in a lower-middle-market portfolio company, and its absence is itself the red flag. A company that cannot produce it does not know which of these concentrations it has, which means nobody has ever looked.
Which concentration risks hide from the financials entirely?
Three of them, and they are the expensive ones.
Platform dependency does not appear on any statement. A company that gets 70 percent of its inbound from Google organic has no line item that says so. It has traffic, and traffic feels like an asset until the platform changes what it does with a query. Across the market, 58.5 percent of United States Google searches already end without a click to any website (SparkToro and Datos, 2024 Zero-Click Search Study), and Pew found that 26 percent of searches with an AI summary end the browsing session entirely. The company did not lose a customer. It lost the road that customers used to arrive on.
Paid dependency hides inside a healthy-looking CAC. A portfolio company running most of its acquisition through paid search or paid social can post an acceptable blended CAC right up until the auction reprices. Forrester found that companies relying primarily on paid channels saw acquisition cost rise about twice as fast as companies with diversified channel mixes (Forrester Research, reported by GrowSurf). A paid-heavy engine is not just expensive; it is a growth plan whose unit economics are set by someone else’s auction. Fixing that is the substance of the capital-efficient growth playbook.
Relationship-sourced revenue looks like sales performance. When the founder or a single rainmaker sources most new business, the sales report shows a strong quarter, not a structural risk. The test is not “how much did this person close.” It is “how much of next year’s pipeline exists only because of who this person knows.” Buyers ask the second question during management meetings, and they ask the customers directly. The Exit Planning Institute reports that only 20 to 30 percent of businesses that go to market actually sell, and buyer-identified risk of exactly this kind sits at the top of the reasons deals die (Exit Planning Institute, cited by Econblox, 2026).
What is the fastest way to reduce concentration risk during the hold?
Diversification is the obvious answer and the wrong first move. Adding channels before you can measure the ones you have produces a more expensive version of the same problem.
The sequence that works in a portfolio company runs in four steps.
Instrument first. Establish pipeline sourcing and CAC by channel, by segment, and by person, over at least four quarters of history. This is usually two to six weeks of work, and it converts an opinion about the demand engine into a measurement. Until it exists, every subsequent decision is a guess.
Rank the dependencies by fragility, not by size. A channel that is 60 percent of pipeline but fully within your control, such as a well-run outbound motion with an owned list, is less fragile than a channel that is 40 percent of pipeline and controlled entirely by a platform that can change its algorithm this quarter. Fragility is the product of size and control, not size alone.
Build the second engine before the first one breaks. The goal is not five channels. It is two independent, measured, repeatable sources of qualified pipeline, neither of which depends on the other, so that the loss of one costs you growth rather than survival. Two working channels is a materially different asset than one working channel and three abandoned experiments.
Transfer the relationships. Where a founder or rainmaker sources demand, the fix is documentation, introduction, and process: a written ICP, a named account plan, a second person in every important customer relationship, and a marketing engine that generates demand the company owns rather than demand a person carries. This is slow, it takes 12 to 24 months, and it is the single highest-return item on most value-creation plans because it converts personal goodwill into enterprise value.
Peter Geisheker states the underlying principle more bluntly:
“You cannot scale a genius. You can only scale a rule.”
The test he applies is simple: if the smartest person on your team quits on Friday, does anything still work on Monday? He is candid that his own systems only partly pass it, and estimates he is roughly a third of the way through encoding his own judgment into rules. That honesty is the point. Person concentration is not solved by a retention bonus, which buys you time and nothing else. It is solved by converting what one person knows into something the company can execute without them, and that work is slow, unglamorous, and almost never funded until a buyer forces it.
Started at close, all four are comfortably achievable within the hold. Started 12 months before a sale, they read as staging, and sophisticated buyers see through staging immediately. That timing argument is developed further in marketing’s role in exit readiness, and the post-close sequencing is covered in the first 100 days after a private equity acquisition.
When is concentration not a red flag?
Frequently, and treating every concentration as a defect is how operating partners lose credibility with management teams.
Concentration is a function of two variables: how much depends on the single point, and how much control you have over it. A customer at 30 percent of revenue on a three-year auto-renewing contract, deeply integrated into the customer’s operations, with switching costs measured in years and a relationship held by four people at your company, is a fundamentally different risk from a customer at 30 percent on a handshake with the founder. Both show up identically in the concentration ratio. Only one of them should scare you.
The same logic holds on the demand side. A company sourcing 60 percent of pipeline from a partner channel it co-owns, with contractual terms and shared economics, is not in the same position as one sourcing 60 percent from a platform it does not control and cannot negotiate with. Deep vertical concentration in a growing end market with genuine domain advantage is often the reason the company wins at all, and diversifying it away can destroy the moat that justified the multiple.
The honest framing, which is also the one that survives contact with a good management team, is this: concentration is not a sin, it is a position. The question is whether the position is deliberate, measured, contractually defended, and understood, or whether it is an accident nobody has looked at. Accidental concentration is the red flag. Deliberate concentration, priced and defended, is often just strategy.
Frequently asked questions
What is demand-engine concentration risk?
Demand-engine concentration risk is the exposure created when a company’s new revenue depends on a single channel, platform, salesperson, customer relationship, or market segment, so that pipeline collapses if that one dependency is removed. It differs from customer concentration, which measures the revenue base a company already has, rather than how new revenue arrives.
What percentage of revenue from one customer is a red flag?
In lower-middle-market M&A, any single customer above 10 percent of revenue is noted, above 20 percent is treated as material concentration, and above 30 percent typically triggers significant discounting or restructured deal terms (KitsWest Capital, 2026). FOCUS Investment Banking puts the valuation discount at 20 to 35 percent once a single customer passes 30 percent of revenue.
How much does customer concentration reduce a business valuation?
Roughly 20 to 35 percent when a single customer exceeds 30 percent of revenue, and the discount is usually accompanied by structural protections rather than applied purely to the headline price: a larger earnout, a bigger escrow, and a longer transition period, all of which shift risk back onto the seller.
How do you assess marketing risk in due diligence?
Measure pipeline sourcing and customer acquisition cost by channel, platform, segment, and person over at least four quarters, then ask what the value-creation plan looks like if the largest of each is cut in half. If the target cannot produce that data, treat the absence as the finding, not as a scheduling problem.
Is founder-sourced revenue a valuation problem?
Yes, and a large one. Founder-dependent businesses receive valuations 30 to 50 percent below comparable owner-independent companies, achieving 3X to 4X EBITDA where independent lower-middle-market peers achieve 7X to 8X (Strategic Exit Advisors, 2026). Buyers also respond with longer earnouts, larger escrows, and mandatory transition agreements.
Why did AI Overviews create a new concentration risk?
Because they repriced a channel that many companies had quietly become dependent on. Ahrefs measured a 58 percent reduction in position-one organic click-through rate on AI Overview keywords between December 2023 and December 2025, and Pew Research found users click a result only 8 percent of the time when an AI summary is present, against 15 percent without. A portfolio company whose pipeline rested on organic search lost a large share of its demand without changing anything it was doing.
How long does it take to fix concentration risk?
Instrumentation takes two to six weeks. Building a genuine second channel takes roughly two to three quarters. Transferring founder-held relationships into the company takes 12 to 24 months. All three fit comfortably inside a hold period that now averages 6.6 years (McKinsey & Company, 2026); none of them fit inside the 12 months before a sale, which is when most companies start.
Installing a concentration-risk diagnostic in your portfolio company
Most operating partners can read this framework and immediately name the portfolio company it describes. The framework is not the hard part. The hard part is installation: actually instrumenting pipeline sourcing where no one has ever tracked it, getting an honest answer about how much revenue lives in one person’s phone, standing up a second channel that works rather than a second channel that exists, and doing all of it while the management team is busy hitting a plan.
That installation work is fractional CMO work. In a portfolio company it usually means owning the marketing number, building sourcing and CAC measurement by channel, ranking the dependencies by fragility, constructing the second engine, and converting founder-held relationships into company-held demand. It produces an asset a buyer will underwrite instead of discount.
Not every company needs this. If your demand engine is already measured, diversified, and documented, you have the rare thing and you should be defending it, not rebuilding it. If you cannot produce pipeline sourced by channel for the last four quarters, you do not know whether you have a concentration problem, which means you almost certainly do.
Schedule a 30-minute call to walk through the diagnostic against a specific portfolio company. No hard sell, no deck; a direct conversation about where the pipeline actually comes from.
About Peter Geisheker
Peter Geisheker is the founder and CEO of The Geisheker Group, Inc., a fractional CMO agency serving B2B, B2B SaaS, PE/VC-backed, and law firm clients. With more than 20 years of B2B marketing leadership, he has managed over $50 million in advertising spend, scaled campaigns to $1 million per week, delivered 6X inbound lead growth, driven 100% year-over-year SaaS revenue growth for three consecutive years, and reduced paid acquisition costs by 77% while growing revenue. He works with private equity firms and their portfolio companies as an embedded fractional CMO, building demand engines tied to EBITDA improvement and exit value. Connect with Peter Geisheker on LinkedIn.
References and Sources
- Bain & Company. “Global Private Equity Report 2026.” https://www.bain.com/insights/topics/global-private-equity-report/
- Bain & Company. “Private equity resurgence gathers steam as new era challenges firms to enhance value creation.” February 23, 2026. https://www.bain.com/about/media-center/press-releases/2026/private-equity-resurgence-gathers-steam-as-new-era-challenges-firms-to-enhance-value-creationbain–company-global-pe-report/
- McKinsey & Company. “Global Private Markets Report 2026: Private equity, clearer view, tougher terrain.” February 10, 2026. https://www.mckinsey.com/industries/private-capital/our-insights/global-private-markets-report/private-equity
- McKinsey & Company. “Beating the odds: How private equity firms can improve exit prospects.” 2026. https://www.mckinsey.com/industries/private-capital/our-insights/beating-the-odds-how-private-equity-firms-can-improve-exit-prospects
- Livmo. “Customer Concentration Risk: How Buyers Price It,” citing FOCUS Investment Banking (July 2025). https://livmo.com/blog/customer-concentration-risk-saas-exit/
- KitsWest Capital. “Customer Concentration and Business Value.” 2026. https://kitswest.com/insights/customer-concentration-business-value
- Strategic Exit Advisors. “Founder Dependency: The Hidden Valuation Killer.” January 2026. https://www.se-adv.com/industry-insights/founder-dependency-hidden-valuation-killer
- LegacyVector. “Key-person Risk,” M&A Glossary. https://legacyvector.com/glossary/key-person-risk
- Sofer Advisors. “Owner Dependency vs Key Person Discount: Which Applies to You?” 2026. https://soferadvisors.com/insights/blog/owner-dependency-vs-key-person-discount-which-applies-to-you/
- Econblox. “Owner Dependency: The Silent Valuation Killer,” citing Exit Planning Institute data. 2026. https://www.econblox.com/owner-dependency-business-valuation/
- Forbes. “The Unexpected Factor That Influences The Valuation.” May 27, 2026. https://www.forbes.com/sites/liendepau/2026/05/27/the-unexpected-factor-that-influences-the-valuation/
- Ahrefs. “Update: AI Overviews Reduce Clicks by 58%.” December 2025 study. https://ahrefs.com/blog/ai-overviews-reduce-clicks-update/
- Search Engine Journal. “Study Confirms Google AI Overviews Cut Organic Clicks 38%,” reporting the Indian School of Business and Carnegie Mellon randomized field experiment and summarizing Pew Research and Ahrefs findings. 2026. https://www.searchenginejournal.com/ai-overviews-cut-organic-clicks-38-field-study-finds/573145/
- ZipTie. “Click Behavior in Zero-Click Search,” compiling Pew Research (68,879 searches), Seer Interactive (25.1 million impressions), and SparkToro/Datos zero-click data. 2026. https://ziptie.dev/blog/click-behavior-in-zero-click-search/
- GrowSurf. “Customer Acquisition Cost Stats (2026),” citing Forrester Research on paid-channel CAC inflation. https://growsurf.com/statistics/customer-acquisition-cost-statistics/
- The Vx Group. “Customer Concentration Risk: What It Is and How to Reduce It.” June 2026. https://www.thevxgroup.com/insights/customer-concentration-risk-what-it-is-and-how-to-reduce-it/
Free Written Growth Plan
Running marketing across a portfolio company?
Get a free written growth plan from two senior CMOs who have helped companies grow into acquisitions. See exactly how we would drive value before you commit.
No hard sell on the call. Your plan arrives within 3 business days. See a sample plan