The average B2B company converts only 13% of Marketing Qualified Leads (MQLs) into Sales Qualified Leads (SQLs), with the steepest funnel drop occurring at this exact transition point. Companies that shift marketing accountability from MQL volume to SQL pipeline contribution achieve up to 3x higher conversion rates and 24% faster revenue growth — without increasing headcount or budget.
Your marketing team just had a record quarter. It produced four hundred Marketing Qualified Leads. The dashboard looks great. The CMO sends a congratulatory Slack message.
Meanwhile, your head of sales is quietly furious — because out of those 400 MQLs, his reps found maybe 40 worth calling, and closed two.
This is not hypothetical. It is happening in B2B companies across every industry, every week. And the question it raises is one of the most important in B2B go-to-market strategy right now: should your marketing team stop measuring MQLs as a primary KPI — and shift 100% of its focus to producing Sales Qualified Leads?
In my experience as a B2B Fractional CMO, this single measurement question is responsible for more wasted marketing budget, more sales-marketing conflict, and more pipeline underperformance than almost any other strategic issue I encounter. This article lays out the data, the argument, and a practical framework for making the transition. Whether you want to explore the idea or are ready to act, I would be glad to discuss your specific situation — schedule a free consultation here.
What MQLs and SQLs Actually Mean — And Why the Definitions Are Usually Broken
Before making the case for change, it is worth being precise about what these terms are supposed to mean and why the definitions collapse in practice at most companies.
A Marketing Qualified Lead (MQL) is a prospect who has shown enough engagement with your marketing content or campaigns that marketing believes they are worth passing to sales. Common MQL triggers include downloading an ebook, attending a webinar, visiting a pricing page, or reaching a lead score threshold. Critically, the MQL definition is set and managed by marketing, and that is a structural problem we will return to.
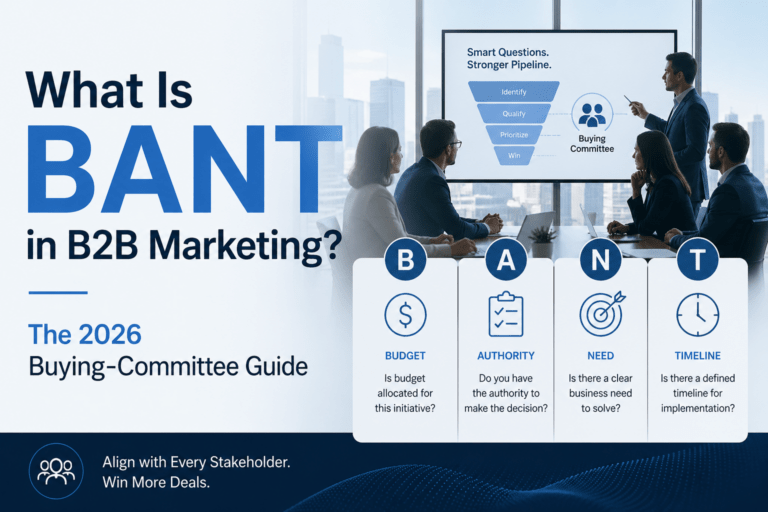
A Sales Qualified Lead (SQL) is a prospect that has been vetted by a salesperson and confirmed as meeting specific purchasing criteria, typically evaluated using a framework like BANT: Budget, Authority, Need, and Timeline. An SQL has demonstrated genuine purchase intent and is ready for an active sales conversation.
The gap between these two definitions should narrow over time as marketing and sales align. In most B2B companies, it does the opposite. Marketing evolves its MQL definition toward behaviors that are easy to measure and easy to scale — content downloads, webinar registrations, ad clicks — while sales holds firm on criteria that actually predict closed revenue. Research from Martal Group confirms this: 68% of B2B organizations have no clearly defined, shared funnel stage definitions (Martal Group, MQL vs SQL in B2B, 2025). Without that shared language, every conversation about lead quality between marketing and sales becomes a negotiation rather than a diagnosis.
The Brutal Math: How Few MQLs Actually Become Paying Clients
Here is the data that should end the MQL-as-primary-KPI debate.
A typical B2B funnel converts approximately 2.3% of website visitors into leads. Of those leads, roughly 31% reach MQL status. Of those MQLs, the industry average conversion rate to SQL is 13%. Of those SQLs, between 20–30% become opportunities. And roughly 22–30% of opportunities close (SerpSculpt, B2B Sales Conversion Rate by Industry 2025).
Run those numbers end to end. For every 10,000 website visitors, you generate approximately 230 leads. Those produce 71 MQLs. Those 71 MQLs yield about 9 SQLs. Of those 9 SQLs, 2–3 become opportunities. And you close one.
One paying customer for every 10,000 website visitors.
The steepest single drop in the entire funnel — the place where the most pipeline is destroyed — is the MQL-to-SQL transition. Current 2025 benchmark data from The Digital Bloom identifies the MQL→SQL stage as “the key bottleneck” in the B2B SaaS funnel, with average conversion rates of 15–21% (The Digital Bloom, B2B SaaS Funnel Benchmarks 2025). Improving that single stage by just 5 percentage points has been shown to lift revenue by up to 18%.
There is also significant variation by lead source that most marketing teams are not tracking at the MQL level:
- Website-generated MQLs: 31% convert to SQL
- Customer and employee referrals: 25% convert to SQL
- SEO-generated leads: 51% convert to SQL
- Webinar-generated leads: 18–30% convert to SQL
- Paid advertising (PPC) leads: 26% convert to SQL
- Email campaign leads: less than 1% convert to SQL
(Source: Geckoboard, MQL to SQL Conversion Rate KPI Guide)
Read that last number again. Email campaign leads convert to SQLs at less than 1% on average. Yet most B2B marketing teams report email as one of their highest-volume MQL sources — and count those MQLs in their KPI dashboard as if they are equivalent to a demo request from an organic search visitor.
When you aggregate all these wildly different lead sources into a single MQL count, you are measuring noise, not signal.
The average MQL-to-SQL conversion rate across B2B is 13%. Companies with strong sales-marketing alignment and behavioral scoring models achieve 39–40% — three times the industry average — without increasing marketing spend.
Why Marketing Teams Became Addicted to MQL Volume
Understanding how we got here requires a brief history.
The MQL was invented roughly two decades ago to give marketing teams a measurable output that sat closer to revenue than raw lead volume or website traffic. It was a genuine improvement at the time. For the first time, marketing had a metric that reflected some level of prospect qualification, not just reach. Leadership finally had something tangible to hold marketing accountable to beyond impressions and clicks.
The problem is structural: MQL volume is a metric that marketing controls entirely. Marketing sets the definition, builds the lead scoring model, and decides which behaviors trigger MQL status. And because marketers are measured and compensated on MQLs, they naturally optimize for generating more of them, which means lowering the bar over time to inflate the numbers.
The result, as GrowthSpree’s B2B pipeline analysis describes it: marketing counts contacts who download whitepapers, watch 40% of a webinar, or fill out a form asking “what does your product do?” — and calls them MQLs. These are not leads. They are contacts. Yet in many B2B organizations, they flow directly into the sales team’s queue as if they are sales-ready (GrowthSpree, The MQL Is Dead in B2B SaaS, 2026).
Marketing teams are also rewarded for volume because it is easy to display. A chart showing 400 MQLs this quarter versus 280 last quarter looks like growth. That the pipeline produced by both quarters was nearly identical is a problem that surfaces months later, long after the performance reviews.
The Real Cost of Optimizing for the Wrong Metric
The organizational cost of MQL-centric marketing is not abstract. It shows up in measurable, recurring ways.
First, wasted sales capacity. Every hour a salesperson spends working on a low-quality MQL is an hour not deployed against a genuine opportunity. At average conversion rates, 87 out of every 100 MQLs will never become an SQL. That is a substantial portion of sales capacity absorbed by leads that were never going to buy.
Second, organizational misalignment. Research published by Martal Group shows that misaligned B2B sales and marketing teams can lose up to 60% of leads in the handoff process, costing companies 10% or more of annual revenue. Aligned sales and marketing teams, by contrast, achieve 24% faster revenue growth and 36% higher customer retention (Martal Group, 2025).
Third, attribution distortion. When marketing is measured on MQL volume, budget allocation follows MQL volume, meaning money flows toward channels that generate the most form fills, not the channels that generate the most SQLs. A PPC campaign that produces 500 MQLs at 26% SQL conversion looks better on a marketing dashboard than an SEO program that generates 100 MQLs at 51% SQL conversion, even though the SEO program produces more qualified pipeline at a lower cost per SQL. For a deeper look at channel selection strategy, see our guide on how to build a B2B marketing channel matrix.
Fourth, strategic blindness. When leadership sees strong MQL growth, they assume marketing is healthy. They do not audit lead quality. They do not scrutinize the MQL definition. They do not push for alignment. The MQL metric provides organizational cover for a pipeline that is, in reality, deteriorating.
The Case for Shifting MQL vs SQL Accountability in B2B Marketing
The argument for making SQL — not MQL — marketing’s primary KPI is both strategic and practical.
Strategically, the SQL is the first point in the funnel where a prospect has been independently verified as having real purchase intent, budget alignment, and authority to make a buying decision. Everything before the SQL is marketing’s hypothesis. The SQL is sales’ confirmation. Measuring marketing on SQLs forces both teams to operate from a shared definition of success because the SQL cannot be gamed by marketing alone.
Practically, when marketing is accountable for SQLs, it changes every upstream decision. Channel selection shifts toward intent-driven channels. Content strategy shifts from top-of-funnel awareness pieces toward bottom-of-funnel content that attracts prospects actively evaluating solutions. Lead scoring models are rebuilt around behaviors that predict purchase intent, not behaviors that are easy to track.
The performance data is unambiguous. Research from Data-Mania shows that B2B SaaS companies using behavioral qualification models aligned to SQL criteria achieve 39–40% MQL-to-SQL conversion rates — three times the 13% industry average — without generating more leads, without increasing budget (Data-Mania, MQL to SQL Conversion Rate Benchmarks 2026).
The growing industry consensus among B2B GTM practitioners now points to three metrics that should replace MQL volume as marketing’s primary performance framework:
- SQLs per month — measures the quality of pipeline contribution
- Pipeline velocity in days — measures speed and efficiency of the full funnel
- CAC payback in months — measures acquisition efficiency and return on marketing investment
Together, these three metrics tell you whether marketing is producing revenue, how fast, and at what cost. MQL volume becomes what it should have always been: a diagnostic input, not a headline KPI.
If you are a B2B or B2B SaaS company leader evaluating whether your current marketing approach is producing the pipeline you need, our Fractional CMO services are built specifically around this kind of pipeline-accountable marketing.
The Geisheker SQL-First Marketing Framework: A Proprietary Approach to Pipeline-Accountable B2B Marketing
At The Geisheker Group, I have developed a structured methodology for transitioning B2B marketing organizations from MQL-volume accountability to SQL-pipeline accountability. I call it the Geisheker SQL-First Marketing Framework — a five-pillar system that rebuilds your go-to-market motion around the metrics that actually drive revenue.
Pillar 1: Unified Lead Definition Architecture
The foundation of SQL-first marketing is a written, mutually agreed-upon definition of every funnel stage — Lead, MQL, SAL (Sales Accepted Lead), and SQL — co-created and co-signed by both marketing and sales leadership. This is not a marketing document that sales is shown. It is a joint document that neither team can change unilaterally.
The definition must specify exact behavioral criteria — not scoring thresholds that can be gamed — and must include explicit disqualifiers. A prospect who downloads a content piece but is a student, a competitor, or an organization outside your ICP should not be an MQL regardless of lead score. Every company I work with in a B2B Fractional CMO engagement starts here, because without this foundation, everything else is temporary.
Pillar 2: Channel-Level SQL Attribution
Most B2B marketing teams can tell you how many MQLs each channel produces. Very few can tell you how many SQLs each channel produces, what the cost per SQL is by channel, or which channels generate SQLs that eventually close. That gap is where budget allocation goes wrong.
Implementing channel-level SQL attribution requires connecting your marketing automation platform to your CRM with offline conversion tracking — building attribution dashboards that show pipeline by source and cost per SQL by campaign. Research from The Digital Bloom confirms that SEO-generated leads deliver a 51% MQL-to-SQL conversion rate compared to just 26% for PPC traffic (The Digital Bloom, 2025). That data should drive budget allocation — but only if you are tracking at the SQL level, not the MQL level.
Pillar 3: Intent-Signal Lead Scoring
The shift from demographic-based lead scoring to behavioral, intent-signal-based lead scoring is the single highest-leverage technical change in any MQL-to-SQL improvement initiative.
Demographic scoring asks: Does this contact match our ICP profile? Behavioral scoring asks: Is this contact showing active buying signals right now? The behaviors that predict SQL conversion are specific: visiting the pricing page multiple times, comparing alternatives on your site, requesting a demo directly, engaging with case studies or ROI calculators, and returning to the site within a short window after initial engagement. Content downloads, webinar registrations, and email opens are engagement signals, not intent signals — and they should be weighted accordingly.
Pillar 4: Speed-to-SQL Service Level Agreements
Even well-qualified MQLs die when the handoff process is slow. The research on this is consistent: following up with a qualified lead within the first hour produces a 53% SQL conversion rate, compared to just 17% for follow-ups that happen 24 hours later — a threefold difference attributable entirely to response time, not lead quality (Data-Mania, 2026).
SQL-first marketing organizations build explicit SLAs around handoff speed: maximum time from MQL trigger to sales contact attempt, maximum time from sales contact to MQL disposition, and a formal feedback loop so marketing receives real-time data on why MQLs are being rejected.
Pillar 5: Revenue-Linked Marketing Accountability
The final pillar is structural: marketing leadership compensation and success metrics must include SQL creation and pipeline contribution, not just MQL volume. When marketing is paid on MQLs, it optimizes for MQLs. When it is paid on SQLs and pipeline, it optimizes for pipeline.
The framework recommended by Brixon Group’s B2B pipeline research — and one I implement with clients — uses three layered marketing performance measures: Qualified Pipeline (sum of forecasted revenue from marketing-sourced opportunities) as the primary KPI; SQL Rate (minimum 20% of MQLs advancing to SQL) as a quality floor; and a Marketing Efficiency Ratio of total marketing costs divided by generated qualified pipeline (Brixon Group, 2025).
“The first thing I do when I engage with a new B2B client is audit not just their marketing metrics, but which team owns the definitions. If marketing controls what counts as an MQL without any input or accountability from sales, you already know why the pipeline is underperforming.” — Peter Geisheker, Fractional CMO, The Geisheker Group, Inc.
What MQL vs SQL Means for Your Lead Nurturing Strategy
An important nuance: shifting to SQL-first accountability does not mean abandoning lead nurturing or top-of-funnel marketing. It means designing your nurture system to accelerate MQL-to-SQL progression rather than simply accumulating MQL volume.
Effective B2B lead nurture sequences — the kind that actually move prospects toward SQL status — are built around buying-stage content, not volume. According to Forrester Research, companies that excel at lead nurturing generate 50% more sales-ready leads at 33% lower cost. That is the distinction: nurturing toward SQLs, not nurturing toward MQL accumulation. For a detailed breakdown of building a nurture system designed around SQL readiness, see our guide on how to create an effective lead nurture sequence for B2B companies.
The SQL-first framework also changes how you think about B2B lead generation more broadly. High-intent channels — organic SEO, direct referrals, targeted ABM outreach — consistently produce higher SQL yield per lead than high-volume, low-intent channels. Our guide on how to generate B2B leads walks through 25 effective strategies with SQL conversion rates factored into channel prioritization.
What Elite B2B Marketing Teams Measure Instead of MQL Volume
The most effective B2B marketing organizations I have worked with have already made this transition. Here is what their performance frameworks look like.
They measure cost per SQL by channel, not cost per MQL. This single metric change shifts every budget allocation conversation. A channel that costs $50 per MQL but converts at 10% to SQL has a real cost of $500 per SQL. A channel that costs $200 per MQL but converts at 50% has a real cost of $400 per SQL. The second channel is more efficient — but under an MQL-volume framework, it looks four times more expensive.
They measure marketing-sourced pipeline as a percentage of total pipeline, with a healthy range of 40–50% for high-performing B2B organizations. The tiered benchmark from Martal Group provides practical targets: floor at 30% marketing-sourced pipeline, healthy at 40–50%, stretch performance above 60% (Martal Group, B2B Digital Marketing Benchmarks 2026).
They measure pipeline velocity — the speed at which revenue moves through the funnel, calculated as: (Number of Opportunities × Average Deal Size × Win Rate) ÷ Sales Cycle Length. Research from The Digital Bloom shows that organizations with weekly pipeline velocity tracking achieve 34% revenue growth versus 11% for those with irregular tracking (The Digital Bloom, 2025).
They still track MQL volume — but as a diagnostic input, not a headline KPI. When MQL volume drops, they investigate. When MQL-to-SQL conversion drops, they investigate. But neither number alone determines success.
Frequently Asked Questions About MQL vs SQL in B2B Marketing
What is the difference between an MQL and an SQL in B2B?
An MQL (Marketing Qualified Lead) is a prospect who has shown engagement with marketing content or campaigns — visiting a pricing page, downloading a guide, attending a webinar — but has not yet been vetted by sales for purchase intent. An SQL (Sales Qualified Lead) has been reviewed by a salesperson and confirmed as having budget, authority, genuine need, and a relevant timeline (BANT criteria). The core distinction is verification: an MQL is marketing’s hypothesis; an SQL is sales’ confirmation.
What is the average MQL-to-SQL conversion rate for B2B companies?
The industry average across B2B is 13%, meaning roughly 1 in 8 MQLs advances to sales-qualified status. This varies significantly by lead source: SEO-generated MQLs convert at 51%, website leads at 31%, referrals at 25%, and paid advertising leads at 26%. Email campaign leads convert at less than 1%. B2B SaaS companies using behavioral scoring models achieve 39–40% conversion — three times the average. (Source: Data-Mania, MQL to SQL Benchmarks 2026)
Should B2B marketing be held accountable for SQLs or only MQLs?
Marketing should be primarily accountable for SQLs and marketing-sourced pipeline, with MQL volume serving as a diagnostic metric rather than a headline KPI. When marketing is compensated on MQL volume, it optimizes for MQL volume — often at the expense of SQL quality. Shifting accountability to SQLs changes every upstream decision: channel selection, content strategy, lead scoring, and handoff processes. Companies that make this shift consistently report faster revenue growth and better sales-marketing alignment. (Source: Factors.ai, MQL vs SQL, 2025)
What does MQL-to-SQL conversion rate tell you about your marketing?
Your MQL-to-SQL conversion rate is one of the most diagnostic metrics in your entire go-to-market system. A rate below 10% signals a structural problem — typically a loose MQL definition, slow sales follow-up, or fundamental misalignment between marketing and sales. A rate above 25% indicates strong alignment and intentional lead qualification. Segment this metric by lead source and channel to identify which marketing activities are generating real pipeline versus which are generating volume without value. (Source: Understory Agency, MQL to SQL Conversion Rate Benchmarks)
How do you improve MQL-to-SQL conversion rates?
The five highest-leverage improvements, in order of impact: (1) Create a joint, written MQL and SQL definition with explicit behavioral criteria — not scoring thresholds — co-owned by marketing and sales. (2) Rebuild lead scoring around intent signals rather than engagement signals. (3) Implement channel-level SQL attribution so budget follows SQL yield, not MQL volume. (4) Establish speed-to-handoff SLAs — following up within one hour triples conversion rates compared to 24-hour delays. (5) Build a formal feedback loop where sales dispositions rejected MQLs in real time, giving marketing the data to fix top-of-funnel targeting. Schedule a free consultation to discuss your specific situation.
What metrics should replace MQL volume as B2B marketing’s primary KPI?
The three metrics that best predict revenue contribution from marketing are: SQLs per month (quality of pipeline contribution), pipeline velocity in days (speed and efficiency), and CAC payback in months (acquisition efficiency). Supporting metrics include cost per SQL by channel, marketing-sourced pipeline as a percentage of total pipeline, and SQL-to-close rate by lead source. MQL volume remains useful as a diagnostic metric, but should not drive marketing performance evaluation. (Source: GrowthSpree, The MQL Is Dead in B2B SaaS, 2026)
What is a realistic MQL-to-SQL conversion rate target for B2B companies?
A conversion rate of 20–25% represents strong performance above the 13% B2B average. Top-quartile performers with advanced behavioral scoring and tight sales-marketing alignment consistently achieve 30–40%. Setting a minimum SQL rate floor of 20% is a practical starting point for any SQL-first marketing transition. A rate below 10% indicates a structural problem that should be addressed before scaling any lead generation investment. (Source: Brixon Group, 2025)
How does the B2B buying process affect MQL and SQL definitions?
The modern B2B buying journey significantly complicates traditional MQL definitions. According to Forrester’s 2024 State of Business Buying Report, buyers research an average of 17 different sources before contacting a vendor, and 83% of the B2B purchasing process now occurs without direct contact with sales representatives (Forrester, State of Business Buying 2024). By the time a prospect becomes an MQL, they may have already completed substantial research and formed a vendor shortlist. For a full breakdown of the B2B buying journey, see our guide on how B2B companies make buying decisions.
The Bottom Line: Stop Celebrating MQL Records and Start Building Real Pipeline
The MQL had its moment. It was genuinely useful when it was invented — a meaningful step forward from measuring marketing on traffic and brand impressions alone. But the way most B2B organizations have implemented it, the MQL has evolved into a metric that obscures more than it reveals, rewards the wrong behaviors, and creates a persistent structural gap between what marketing produces and what sales actually needs.
The data is conclusive. Only 13% of MQLs become SQLs on average. The MQL-to-SQL stage is the single biggest leak in the B2B funnel. And companies that have shifted to SQL-first marketing accountability — building behavioral scoring models, implementing unified lead definitions, and measuring marketing on pipeline contribution rather than lead volume — are achieving conversion rates three times higher than the industry average.
That is not a marginal improvement. It is a competitive advantage that compounds every quarter.
If your B2B marketing team is still reporting MQL volume as its headline KPI, the question is not whether you have a problem. Understanding where your funnel is leaking is exactly what a B2B marketing strategy framework is built to reveal — and fixing it is what a Fractional CMO engagement is designed to accomplish.
Ready to stop measuring the wrong thing? Schedule a free 30-minute consultation with Peter Geisheker to discuss your B2B marketing performance and what SQL-first accountability could look like for your organization.
About Peter Geisheker
Peter Geisheker is a Fractional CMO and founder of The Geisheker Group, Inc., a B2B marketing strategy and revenue growth consultancy serving B2B companies, B2B SaaS firms, and PE/VC-backed portfolios nationwide. With over 20 years of experience building pipeline-accountable marketing systems for small and mid-size B2B companies, Peter provides senior-level strategic marketing leadership without the full-time executive cost. His work has been recognized by Inc. Magazine, Entrepreneur Magazine, FORTUNE Small Business Magazine, and The New York Times.
Ready to explore how a Fractional CMO can accelerate your B2B pipeline growth? Schedule a free consultation with Peter Geisheker.
References and Sources
- Martal Group — “MQL vs SQL in B2B: Funnel Strategy for B2B Growth” (2025). https://martal.ca/mql-vs-sql-lb/
- The Digital Bloom — “2025 B2B SaaS Funnel Benchmarks & Pipeline Audit Framework” (October 2025). https://thedigitalbloom.com/learn/pipeline-performance-benchmarks-2025/
- Data-Mania — “MQL to SQL Conversion Rate Benchmarks 2026” (April 2026). https://www.data-mania.com/blog/mql-to-sql-conversion-rate-benchmarks-2025/
- GrowthSpree — “The MQL Is Dead in B2B SaaS” (March 2026). https://www.growthspreeofficial.com/blogs/mql-dead-b2b-saas-2026-pipeline-metrics-that-matter
- SerpSculpt — “B2B Sales Conversion Rate by Industry 2025” (November 2025). https://serpsculpt.com/reports/b2b-sales-conversion-rate-by-industry/
- Geckoboard — “MQL to SQL Conversion Rate KPI Guide.” https://www.geckoboard.com/best-practice/kpi-examples/mql-to-sql-conversion-rate/
- Brixon Group — “Improve MQL Quality: 7 Quick Wins for a Higher SQL Rate” (May 2025). https://brixongroup.com/en/improve-mql-quality-7-quick-wins-for-a-higher-sql-rate-in-the-b2b-sector
- Understory Agency — “MQL to SQL Conversion Rates: B2B SaaS Benchmarks.” https://www.understoryagency.com/blog/mql-to-sql-conversion-rate-benchmarks
- Factors.ai — “MQL vs SQL: The Key Difference Driving Sales & Marketing Alignment” (November 2025). https://www.factors.ai/blog/mql-vs-sql
- Martal Group — “B2B Digital Marketing Benchmarks 2026” (March 2026). https://martal.ca/b2b-digital-marketing-benchmarks-lb/
- Forrester Research — “State of Business Buying 2024.” https://www.forrester.com/research/b2b-buying/
- MarketJoy — “B2B Sales Pipeline Conversion Rates” (September 2025). https://marketjoy.com/b2b-sales-pipeline-conversion-rates-marketjoy-data/