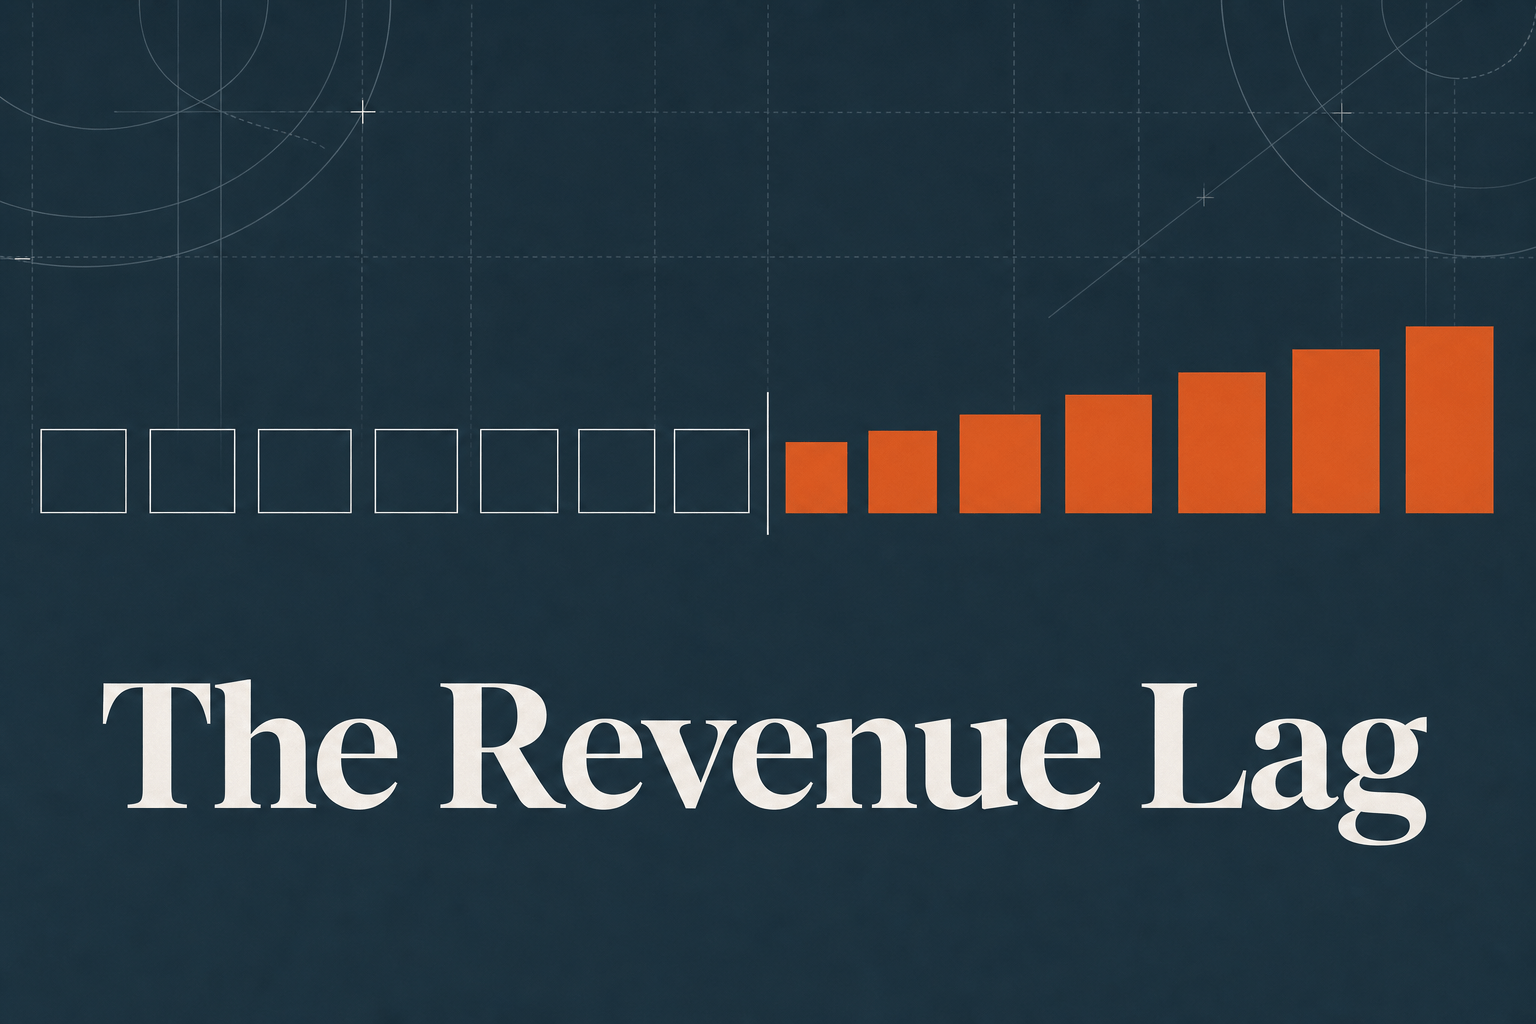
A B2B marketing revenue forecast is a month-by-month projection that converts marketing spend into booked revenue by chaining four inputs, opportunity creation, win rate, average deal value, and time to close, then shifting the output forward by the full length of the sales cycle. With a six-month cycle and a three-month ramp, money spent in January books as revenue in July, and the program does not reach its full monthly run rate until September. Year one collects roughly 42% of the run rate it will be earning by the time year one ends.
Key Facts at a Glance
- Marketing-sourced opportunities close at 27%, against 43% for sales-sourced and 52% for customer-success-sourced opportunities (ICONIQ, The State of Go-to-Market in 2026). Forecasting marketing pipeline at the company-wide win rate overstates marketing-sourced bookings by about 59%.
- Average sales cycles run 12 weeks for deals between $10,000 and $50,000, 17 weeks between $50,000 and $100,000, and 24 weeks above $100,000 (ICONIQ, 2026). A six-month cycle is normal, not pathological, once deal sizes pass six figures.
- Funnel conversion at high-growth B2B software companies runs about 28% new lead to MQL, 30% MQL to SQL, and 28% SQL to closed won (ICONIQ, 2026).
- The average B2B buying cycle is 10.1 months, down from 11.3 months the prior year, and first seller contact now happens at 61% of the journey rather than 69% (6sense, B2B Buyer Experience Report for 2025, nearly 4,000 buyers).
- 36% of deals slipped out of the period they were forecast in during 2025, improved from 44% in 2024 (Ebsta and Pavilion, GTM Benchmark Report 2025, 655,000 opportunities across 387 companies).
- 52% of sales leaders report their forecasts are off by 10% or more (Xactly, 2024 Sales Forecasting Benchmark Report, a vendor-run survey of 405 sales and finance leaders).
- Only 27% of CEOs and CFOs say their CMO’s performance exceeded expectations, rising only to 45% among CMOs who actually hit their commercial targets (Gartner, February 2025, survey of 125 CEOs and CFOs).
This guide draws on Peter Geisheker’s 20-plus years of B2B marketing experience as founder of The Geisheker Group, Inc., a fractional CMO agency serving B2B, B2B SaaS, PE/VC-backed, and law firm clients. He has managed more than $50 million in advertising spend. Documented client outcomes include 6X inbound lead growth, 100% year-over-year SaaS revenue growth for three consecutive years, a 77% reduction in paid acquisition spend while revenue grew, and programs scaled to $1 million per week. The model below reflects engagements where the gap between marketing investment and booked revenue had to be defended in front of a CFO, informed by 2026 benchmark data from ICONIQ, 6sense, Ebsta and Gartner.
Contents
- Why does a six-month sales cycle break a normal marketing forecast?
- What are the four inputs a B2B revenue forecast actually runs on?
- How do you get these four numbers out of your own CRM?
- Which win rate belongs in the model?
- What does the worked model look like month by month?
- What do the conservative, expected and upside cases produce?
- When does today’s marketing actually produce revenue?
- What do you measure in months one through six, when there is no revenue?
- What happens when you change the budget mid-year?
- Why does the 3x pipeline coverage rule fail here?
- What does this model deliberately leave out?
- How do you put this in front of a CFO without losing the room?
- Frequently asked questions
- Implementing this forecast in your company
Need marketing leadership and expert strategy to grow your company?
The Geisheker Group is a fractional CMO agency for B2B, B2B SaaS, and PE-backed companies. We install the measurement, the strategy, and the acquisition system, then we hold ourselves to the number.
Why does a six-month sales cycle break a normal marketing forecast?
Because almost every marketing forecast in circulation is a spreadsheet that multiplies spend by an efficiency assumption and lands the answer in the same column it started in. Spend $50,000 in March, book revenue in March. That works for e-commerce. In B2B it describes an event that cannot physically happen.
The deal you close in September was created as an opportunity in March. The March marketing budget is the thing that produced it. So a forecast that reports March spend against March revenue is comparing this month’s investment to the results of an investment made half a year ago, which is a measurement error, not a performance signal. This is the same structural problem behind measuring marketing on a window shorter than your sales cycle, and it is why marketing programs get killed in month four of a six-month cycle.
The forecast has a second job that gets forgotten, and it is the one that matters more. Before it tells you when revenue arrives, it has to tell you whether the revenue is worth the acquisition cost at all. Peter Geisheker, founder of The Geisheker Group, has resigned an engagement on exactly that arithmetic.
The advertising math did not work. CAC payback was nine months on a low-cost subscription in a competitive market. The CEO was happy with my work. I left anyway, because I could not solve it and he deserved someone who would test ideas I was not seeing.
That was a SaaS company with a good product, a low monthly price, and an expensive competitive category. The model was not wrong. The model was right, and what it said was stop. A forecast that can only produce optimistic numbers is not a forecast, it is a pitch deck. Bessemer Venture Partners publishes segment targets that give you a fast sanity check on the same question: CAC payback under 12 months for SMB-focused sales motions, under 18 months for mid-market, and under 24 months for enterprise.
What are the four inputs a B2B revenue forecast actually runs on?
Four, plus timing. Everything else in a marketing dashboard is diagnostic detail that belongs somewhere other than the revenue line.
- Opportunity creation. How many qualified opportunities the program produces per month. This is where spend enters the chain, usually as spend divided by cost per marketing qualified lead, then multiplied by the rate at which MQLs are accepted as real opportunities. If you are still arguing about that acceptance rate, the argument is upstream of the forecast and belongs in your MQL versus SQL definitions, not in the model.
- Win rate. The share of created opportunities that close won. Covered in its own section below, because this is the input most forecasts get wrong in a way that inflates the answer by more than half.
- Average deal value. The mean contract value of a won deal. Use a median if your distribution has a long tail, because one whale in the average makes the whole forecast a fiction.
- Time to close. Months from opportunity creation to closed won. This does not change the size of the answer. It changes which month the answer lands in, and in year one that is the whole ballgame.
The fifth variable is the one operators forget: ramp. A program does not produce its steady-state opportunity volume in month one. Tracking has to be correct, creative has to be tested, and the ad platforms have to learn who converts. Meta documents this explicitly, requiring roughly 50 optimization events per ad set per week before delivery stabilizes. Peter Geisheker treats that threshold as a fixed cost of entry rather than a line to negotiate.
Meta’s algorithm needs roughly fifty conversions in seven days before it stops guessing. So if your leads cost a hundred dollars, that is five thousand dollars a week. That is not me being greedy with your money. That is the entry fee.
Run that arithmetic at B2B prices and it stops being a footnote. At a $500 cost per lead, 50 conversions a week is $25,000 per week, per ad set, which is more than double a $50,000 monthly budget before you have run a second ad set. That is the real reason serious B2B lead generation optimizes toward an upper-funnel conversion event rather than the demo request: not because the demo request matters less, but because at B2B lead costs you cannot feed the algorithm enough of them to ever exit learning. Budget the ramp honestly, or the first three months of your forecast are fantasy.
How do you get these four numbers out of your own CRM?
Benchmarks are a starting position, not an answer. A forecast built entirely on other companies’ averages will be wrong in ways you cannot see, because the errors are hidden inside numbers that look authoritative. The goal is to replace every benchmark with your own figure, one at a time, as the data matures.
Each of the four inputs has a correct extraction method and a common mistake that quietly inflates the result.
Time to close. Measure from opportunity creation date to closed-won date, on deals that closed in the last twelve months. Use the median, not the mean, because one enterprise deal that took eighteen months will drag a mean badly. Two mistakes are near universal here. The first is measuring from lead creation rather than opportunity creation, which folds the marketing nurture period into the sales cycle and makes the number look worse than it is. The second is measuring open pipeline, which systematically understates the cycle, because the deals that have not closed yet are precisely the slow ones.
Win rate. This one has a subtle trap that costs companies real money. The number most CRMs report is a snapshot: closed won divided by closed won plus closed lost. That excludes every opportunity still open, and since losses tend to resolve faster than wins in complex B2B deals, the snapshot can run high or low depending on the moment you take it. What the forecast needs is a cohort win rate. Take every opportunity created in a month that is now at least one full sales cycle in the past, and ask what share of that specific cohort closed won. On a six-month cycle, a cohort from twelve months ago is mature enough to trust. A cohort from three months ago tells you nothing.
Average deal value. Median of won deals over the last twelve months, segmented by source if your sources behave differently. Then look at the actual distribution before you use it. If your top three deals are five times your median, you do not have an average deal value; you have two businesses sharing a pipeline, and they need separate lines in the model.
Opportunity creation. Program spend divided by cost per marketing qualified lead, times the rate at which MQLs are accepted. The honest complication is that opportunities created this month were partly produced by earlier months’ spend, so a single-month cost figure is noisy. At steady state this self-corrects. During ramp it overstates your cost, which is another reason the ramp period should not be judged on efficiency.
How much data you need before the model means anything. One full sales cycle of closed deals is the minimum, and two is where the numbers stop moving every time you refresh them. On a six-month cycle that is twelve months of clean CRM history. Below that threshold, run the benchmark version, label every borrowed input as an assumption inside the model itself, and replace them as your own cohorts mature. A forecast whose assumptions are visible is more useful than one whose assumptions are buried, even when the buried version happens to be more precise, because only the visible one can be argued with.
One prerequisite sits underneath all four. If sales and marketing do not agree on what counts as an opportunity, none of these numbers are stable, because the definition is being renegotiated every time someone disputes a result. Settle that first. It is a sales and marketing alignment problem, not a modeling one, and no amount of spreadsheet work will fix it from the outside.
Which win rate belongs in the model?
The marketing-sourced one. Not the company-wide one. This single substitution is the most common and most expensive error in B2B marketing forecasting, and it is now measurable.
ICONIQ’s State of Go-to-Market in 2026, drawn from 150-plus B2B software companies, breaks win rate out by opportunity source. Customer-success-sourced opportunities close at 52%. Sales-sourced close at 43%. Channel and partner close at 39%. Marketing-sourced close at 27%.
The gap is not a knock on marketing. It is a description of what marketing-sourced means: an opportunity created from a stranger who raised a hand, rather than one created inside an existing relationship where the buyer has already seen the value delivered. Those are different objects, and they convert differently.
What it does to a forecast is severe. Take the model below, holding every other input constant. At the marketing-sourced 27%, steady-state bookings come to $405,000 per month. At the company-wide 43%, the same model reports $645,000. That is a 59% overstatement, produced entirely by one cell, and it is the number the CFO will eventually discover.
Two related figures are worth holding alongside it. ICONIQ also reports that high-growth B2B software companies derive roughly 15% to 20% of pipeline from marketing, against 60% to 80% from sales and channel motions. And Forrester’s State of Business Buying, 2026, drawn from nearly 18,000 global business buyers, puts the typical buying decision at 13 internal stakeholders plus nine external influencers. A forecast that treats a marketing-sourced opportunity as a single decision-maker with a sales-sourced win rate is wrong twice.
Twenty years of B2B revenue growth, with the receipts.
6X inbound lead growth. A 77% reduction in paid acquisition cost while revenue grew. Programs scaled to $1 million per week. If your marketing produces activity but not pipeline, that is a fixable problem.
What does the worked model look like month by month?
Here is the whole thing, worked, for a B2B company with a six-month sales cycle. Substitute your own numbers; the structure is what transfers.
The setup. Monthly marketing program spend of $50,000, covering media, content and tooling but not salaries. Cost per marketing qualified lead of $500. Thirty percent of MQLs are accepted as opportunities. Marketing-sourced opportunities close at 27%. Average deal value of $50,000. Six months from opportunity creation to closed won. Opportunity creation climbs to full rate over three months.
The chain, at steady state.
| Step | Calculation | Result |
|---|---|---|
| Marketing qualified leads | $50,000 ÷ $500 | 100 / month |
| Opportunities created | 100 × 30% | 30 / month |
| Deals won | 30 × 27% | 8.1 / month |
| Bookings | 8.1 × $50,000 | $405,000 / month |
| Annualized run rate | $405,000 × 12 | $4,860,000 |
| Marketing cost per customer | $50,000 ÷ 8.1 | $6,173 |
That table is what every marketing forecast shows, and on its own it is misleading, because it describes a state the program does not reach for nine months. Here is the same model with time in it.
| Month | Spend | Opportunities created | Bookings | Cumulative bookings |
|---|---|---|---|---|
| 1 | $50,000 | 10 | $0 | $0 |
| 2 | $50,000 | 20 | $0 | $0 |
| 3 | $50,000 | 30 | $0 | $0 |
| 4 | $50,000 | 30 | $0 | $0 |
| 5 | $50,000 | 30 | $0 | $0 |
| 6 | $50,000 | 30 | $0 | $0 |
| 7 | $50,000 | 30 | $135,000 | $135,000 |
| 8 | $50,000 | 30 | $270,000 | $405,000 |
| 9 | $50,000 | 30 | $405,000 | $810,000 |
| 10 | $50,000 | 30 | $405,000 | $1,215,000 |
| 11 | $50,000 | 30 | $405,000 | $1,620,000 |
| 12 | $50,000 | 30 | $405,000 | $2,025,000 |
Six months of spend, $300,000, against zero booked revenue. That is not a failing program. That is a correctly functioning program with a six-month sales cycle, and if nobody explained that in advance, month five is where it gets cancelled.
The first six rows of this table are the entire reason marketing programs die. They are also completely predictable, which means there is no excuse for anyone in the room being surprised by them.
Year one closes at $2,025,000 of bookings on $600,000 of spend, a 3.4x return, while the program exits the year running at a $4,860,000 annualized rate. Year two, with no increase in spend, books the full $4,860,000. The same program is an 8.1x return in year two and a 3.4x return in year one, and the only thing that changed is that the lag stopped eating the calendar.
Run this model with your own numbers in the interactive version, which computes all three scenarios month by month and shows exactly which month your first dollar lands in.
What do the conservative, expected and upside cases produce?
A single-point forecast in B2B is close to useless, because four multiplicative inputs each carrying reasonable uncertainty compound into an enormous range. Modeling that range is not hedging. It is the honest description of what you know.
| Input | Conservative | Expected | Upside |
|---|---|---|---|
| Cost per MQL | $650 | $500 | $425 |
| MQL to opportunity | 24% | 30% | 34% |
| Opportunity win rate | 20% | 27% | 32% |
| Average deal value | $45,000 | $50,000 | $55,000 |
| Months to close | 8 | 6 | 5 |
| Months to full ramp | 5 | 3 | 2 |
| Steady-state bookings | $166,154/mo | $405,000/mo | $704,000/mo |
| First booked revenue | Month 9 | Month 7 | Month 6 |
| Full run rate reached | Month 13 | Month 9 | Month 7 |
| Year 1 bookings | $332,308 | $2,025,000 | $4,576,000 |
| Year 1 return on spend | 0.55x | 3.38x | 7.63x |
| Year 2 bookings | $1,993,846 | $4,860,000 | $8,448,000 |
Now look at the two spreads, because the relationship between them is the single most useful thing in this article.
At steady state, the upside case is 4.2 times the conservative case. In year one, the upside case is 13.8 times the conservative case.
The lag does not just delay the revenue. It multiplies the uncertainty. Two extra months of sales cycle and two extra months of ramp turn a 4x spread into a 14x spread, which is why year-one marketing forecasts are the least reliable number in the business and get treated as the most authoritative.
The conservative case deserves its own sentence. It returns 0.55x in year one. The program loses money for twelve months and then returns 3.3x in year two on identical spend. If your board has approved a twelve-month evaluation window on a program with an eight-month cycle and a five-month ramp, you have approved a program that is structurally guaranteed to look like a failure at the moment it is judged. That is not a marketing risk. It is a governance error, and it should be fixed in the operating agreement before a dollar is spent.


Not sure what is working? Get a free written plan
30 minutes with both of us. No hard sell. Written plan in 3 business days.
When does today’s marketing actually produce revenue?
In the expected case, money spent today books as revenue in month seven, the program reaches its full monthly rate in month nine, and year one collects about 42% of the run rate the program is earning by the time year one ends.
Those three numbers are the answer, and they are the three numbers to put in front of a CEO before the program starts rather than after it disappoints. Everything else in a marketing forecast is commentary.
The longer horizon matters too, and it is the part that almost nobody has the patience to hold. Peter Geisheker has run the extended version of this curve.
I took a B2B SaaS company from two hundred fifty thousand dollars to two million. It doubled, then doubled again, then a third time. The lever was content nobody had the patience to keep writing.
That was a B2B SaaS proposal-software company, over four years: $250,000, then $500,000, then $1 million, then $2 million. The mechanism was more than a hundred SEO articles, focused Google Search and remarketing, LinkedIn into target accounts, and Meta retargeting, with paid and organic occupying the same buyer terms simultaneously. The honest caveats are that it is one company and the market was less crowded then. The transferable part is not the multiple, it is the patience: most teams abandon a content program around article twenty, when the spreadsheet is still flat. On a six-month cycle, article twenty is roughly where the first article’s revenue would have started arriving.
Two pieces of buyer-side evidence explain why the patience is structurally required rather than a virtue. 6sense measures the average B2B buying cycle at 10.1 months, with first seller contact at 61% of the journey, meaning most of the buying process happens before your CRM knows the deal exists. And the Ehrenberg-Bass Institute’s widely used 95-5 heuristic, developed for the LinkedIn B2B Institute, holds that up to 95% of business buyers are not in the market at any one time; its author, John Dawes, presents it explicitly as a heuristic for getting the idea across rather than a measurement, and tells practitioners to compute their own category’s figure from their average interpurchase interval. Either way the implication for the forecast is the same: a quarterly measurement window can only ever see the small share of your addressable market that happens to be buying now.
What do you measure in months one through six, when there is no revenue?
This is the question that decides whether the program survives long enough to work, and most teams have no answer to it. They present a revenue forecast, then go quiet for six months, then get cancelled in month five by a CEO who has watched $250,000 leave with nothing to show for it.
The fix is to agree, in advance, on what is knowable in each month and what decision it supports. Revenue is not knowable until month seven. Opportunity creation is knowable by month three, and it is the input the entire forecast rests on, so it is a perfectly good thing to be judged on.
| Month | What is actually knowable | The decision it supports |
|---|---|---|
| 1 to 2 | Tracking integrity, lead volume, cost per lead. Roughly 10 to 20 opportunities created against a plan of 30 per month at full rate. | Fix instrumentation. Judge nothing else. Cost per lead in month one is measuring the learning phase, not the program. |
| 3 | First month at full opportunity creation rate. Cumulative opportunities should be near 60. | Is opportunity creation within 25% of plan? If not, the problem is in acquisition, and it is cheap to fix now. |
| 4 | Cumulative opportunities near 90, plus early stage progression. Enough data to see whether opportunities move or stall. | The real decision point. Continue, adjust, or stop. Set this date before the program starts, in writing. |
| 5 to 6 | Stage velocity on the first cohorts. Cumulative opportunities near 150. Still $0 booked, $300,000 spent. | Is the cycle-length assumption holding? If month-one opportunities are not late-stage by month five, the cycle is longer than modeled and the whole forecast shifts right. |
| 7 to 8 | First closed-won deals from the month-one cohort. | First read on win rate, from a small sample. Do not rewrite the model on three deals. |
| 9 | Full monthly run rate reached. The model is now testable against reality. | Compare actual monthly bookings to the forecast. This is the first fair judgment of the program. |
| 13 | A full cohort of created opportunities has resolved to won or lost. | Rebuild the model on your own numbers and retire the benchmarks. |
Opportunity creation is knowable in month three. Revenue is not knowable until month seven. Any governance process that ignores the first and demands the second is choosing to fly blind for four months and then panic.
The month-four decision point is the single most valuable thing to negotiate before a program starts. It gives the CEO a real gate rather than an open-ended request for patience, and it gives marketing a defined window in which the absence of revenue is not evidence of failure. Both sides get something. Without it, the gate exists anyway; it just arrives unannounced, in whichever month the CFO’s patience runs out.
What happens when you change the budget mid-year?
Something genuinely counterintuitive, and it is the most important consequence of the whole model. Run the expected case for six months, then change the budget at month seven and watch what happens to bookings.
| Change made at month 7 | Bookings, months 7 to 12 | Bookings, months 13 to 18 |
|---|---|---|
| No change, $50,000/mo throughout | $2,025,000 | $2,430,000 |
| Spend cut 50%, to $25,000/mo | $2,025,000 | $1,215,000 |
| Spend stopped entirely, to $0 | $2,025,000 | $0 |
| Spend doubled, to $100,000/mo | $2,025,000 | $4,860,000 |
Look at that middle column. Every row is identical. Cutting the marketing budget in half, stopping it completely, or doubling it produces exactly the same bookings for the next six months, because those bookings were already determined by opportunities created before the change was made.
Cutting marketing spend in half looks free for one full sales cycle. You bank $150,000 of savings, revenue does not move, and the decision looks vindicated. The bill arrives in month 13, by which point almost nobody attributes it to the cut.
This is the mechanism behind most bad marketing budget decisions, and it explains behavior that otherwise looks irrational. A CFO who cuts marketing and observes no revenue impact has not made a mistake in reasoning. The evidence available inside the observation window genuinely supported the cut. The problem is that the window was shorter than the sales cycle, so it could only ever contain the savings and never the cost.
The same asymmetry runs in the other direction and does just as much damage. Doubling the budget also shows nothing for six months. That is why budget increases get approved in January, judged in April, found wanting, and reversed in May, one month before the first additional revenue would have appeared. The increase never gets to prove itself, and the reversal is recorded as evidence that marketing does not scale.
Three practical consequences follow, and they are worth writing into how the company operates rather than leaving to argument.
- Never evaluate a budget change on less than one full sales cycle plus the ramp. On a six-month cycle that is nine months minimum. Anything shorter is measuring the previous budget.
- Judge a budget change on opportunity creation, not revenue. Opportunity creation responds within the ramp period, so a cut shows up in month two or three, where it can still be reversed cheaply. That is the early warning system, and it is free.
- When you do cut, model the month-13 cliff and put it in writing. The cut may well be correct; cash constraints are real and a company that runs out of money does not get to enjoy its pipeline. But the decision should be made with the cliff visible, not discovered later. This is also the single strongest argument for treating marketing budget cuts as a sequencing question rather than a percentage question.
For companies backed by institutional capital the stakes are higher again, because a mid-year cut that looks free inside the holding period can quietly remove two quarters of pipeline from the exit year. That is one reason this lag model is usually the first thing to build in a portfolio company, before anyone touches the spend itself.
Why does the 3x pipeline coverage rule fail here?
Because 3x is not a finding. Go looking for the study behind it and there is nothing to find: the rule circulates through vendor blogs, glossary pages and consultant posts citing each other, with no research organization publishing data that establishes it. Salesforce has published an article arguing the rule is broken. It is convention that became self-fulfilling because teams built their pipeline targets around it.
The replacement is arithmetic, not convention. Required pipeline coverage is one divided by your win rate.
| Win rate on this pipeline | Coverage actually required |
|---|---|
| 43% (sales-sourced, ICONIQ 2026) | 2.3x |
| 32% (upside case) | 3.1x |
| 27% (marketing-sourced, ICONIQ 2026) | 3.7x |
| 20% (conservative case) | 5.0x |
The 3x convention implicitly assumes a 33% win rate. That is above the marketing-sourced benchmark and well above a conservative case, which means a company holding marketing to 3x coverage on marketing-sourced pipeline is running structurally thin and will miss without anyone being able to say why.
Coverage also has to survive slippage. Ebsta and Pavilion found 36% of deals slipped out of their forecast period in 2025, improved from 44% in 2024, and Ebsta’s earlier analysis found win rates fell by 67% in relative terms when deals slipped, particularly past eight weeks. Slippage does not merely move revenue to a later month. It reduces the probability that the revenue arrives at all, which is why the conservative column of your model should carry a longer cycle rather than the expected column carrying a vague haircut.
What does this model deliberately leave out?
Stating the limits is what makes the rest defensible, and a forecast presented without them will be dismantled by the first competent CFO who reads it.
- Seasonality. The model assumes flat monthly opportunity creation. Most B2B categories have a December and a summer that do not behave.
- Sales capacity. Thirty opportunities per month arriving into a team that can work eighteen produces a queue, not revenue. The forecast assumes capacity exists.
- Renewals and expansion. These are new bookings only. In a subscription business the compounding base is usually the larger number, and it belongs in a separate model.
- Deal-value drift. Average deal value is held constant. Programs that scale volume often scale it at the cheaper end of the market, and deal value drifts down as spend goes up.
- Attribution error. The model assumes you can tell which opportunities marketing created. Most companies cannot, cleanly, which is a prerequisite problem rather than a modeling one. Nielsen’s 2025 Marketing ROI Blueprint reports that 85% of marketers are confident in their ability to measure ROI while only 32% actually measure holistically across channels. Fix your B2B lead attribution model before you trust any forecast built on top of it.
- The buying committee. Modeling an opportunity as one unit hides the fact that finance now sits in the B2B buying committee, and a deal that clears the champion can still die in procurement.
How do you put this in front of a CFO without losing the room?
Lead with the lag, not with the total. The credibility of the whole exercise rests on whether you volunteered the bad news before you were asked for it.
Open with the sentence that costs you something: this program books nothing for six months, and here is the month it starts. Then show the three scenarios together, never the expected case alone. Then name the decision point in advance, which is the month you will know whether opportunity creation is tracking to the expected case, and that month is usually four, well before any revenue exists to judge.
The reason to lead this way is that finance has already decided marketing cannot prove its numbers. Gartner found that only 52% of senior marketing leaders were successful in proving the value of marketing, and that 47% report marketing is viewed as an expense rather than a strategic investment. Gartner’s survey of 125 CEOs and CFOs found only 27% say their CMO exceeded expectations, and that even among CMOs who hit their commercial targets the figure only reaches 45%. Meanwhile The CMO Survey’s Spring 2026 edition rates the CMO and CFO partnership at just 4.5 on a 7-point scale, effectively unchanged in four years.
A forecast that shows a loss in months one through six and says so in advance does more for that relationship than a forecast that turns out to be right. Companies backed by institutional capital feel this most acutely, which is why fractional CMO work in private equity so often begins with rebuilding the forecast before touching a single campaign. It is also the substance behind the B2B marketing KPIs that actually matter: a KPI that moves in month two and a revenue number that moves in month nine are both true, and the forecast is what connects them.
Frequently asked questions
How do I forecast marketing revenue when my sales cycle is six months?
Build the chain first, spend to leads to opportunities to wins to revenue, then place each month’s bookings in the month the deal closes, which is the month the opportunity was created plus the cycle length. Add a ramp period of two to five months for opportunity creation to reach full rate. In a six-month cycle with a three-month ramp, first revenue lands in month seven and full run rate in month nine.
What is a realistic B2B marketing win rate to use in a forecast?
Use your own if you have twelve months of clean data. If you do not, ICONIQ’s 2026 benchmark puts marketing-sourced opportunities at 27% and sales-sourced at 43%. Use the marketing-sourced figure for marketing-sourced pipeline. Substituting the company-wide rate overstates the forecast by roughly 59%.
How much data do I need before this forecast means anything?
One full sales cycle of closed deals is the minimum and two is where the numbers stop moving every time you refresh them, so twelve months of clean CRM history on a six-month cycle. Below that, run the benchmark version with every borrowed input labeled as an assumption inside the model, and replace them with your own cohort data as it matures.
How much pipeline coverage do I actually need?
One divided by your win rate. At a 27% win rate that is 3.7x, not the conventional 3x. The 3x rule has no published research behind it and implicitly assumes a 33% win rate, which is higher than the marketing-sourced benchmark.
How long before a new marketing program shows revenue?
Ramp plus sales cycle. Two to five months of ramp, then the full cycle. For a six-month B2B cycle that is realistically seven to nine months before revenue is visible, and twelve to thirteen months before the monthly rate stabilizes. On an eight-month cycle it is month nine before the first dollar and month thirteen before full rate.
Can I cut marketing spend without hurting revenue?
For one full sales cycle, yes, and that is exactly the trap. Cutting spend in half at month seven produces identical bookings through month twelve, because those deals were created before the cut. Bookings then fall by half in month thirteen. The savings are visible immediately and the cost is invisible for six months, which is why marketing gets cut and why the cut usually looks justified at the time it is reviewed.
What is the difference between a sales forecast and a marketing revenue forecast?
A sales forecast projects deals already in the pipeline to a close date. A marketing revenue forecast projects deals that do not exist yet, starting from spend, which is why it needs the ramp and the lag that a sales forecast does not. The two should reconcile at the opportunity layer; if they do not, one of them is counting something the other is not.
Should I forecast bookings or recognized revenue?
Model bookings, then convert. Bookings are what marketing influences and what closes on the date the model predicts. Recognized revenue depends on contract terms and billing schedules that marketing does not control, and mixing them is how a forecast becomes unfalsifiable.
When should I revise the forecast?
Revise the inputs monthly and the structure quarterly. Opportunity creation gives you a real signal by month three or four, well before any revenue exists. Win rate and cycle length need a full cycle of closed deals before they mean anything, so resist rewriting them in month two on the evidence of three deals.
How do I forecast when I cannot tell which opportunities marketing created?
You do not, reliably, and the honest move is to say so and fix the attribution first. A forecast built on contested source data will be litigated rather than used. Agree the definitions with sales, instrument the capture, then run one full cycle before publishing numbers anyone is held to.
Implementing this forecast in your company
Most teams understand this model the moment they see the month-by-month table. The harder problem is that acting on it means renegotiating what your marketing program is judged on and when, and that conversation involves finance, sales and usually the board. The model is an afternoon of work. The agreement that year one is a 3.4x and not an 8x, and that months one through six will show a loss on purpose, is a different kind of project.
That installation work is fractional CMO work: agreeing the opportunity definition with sales so the top of the model is not contested, instrumenting the capture so the inputs are real, setting the decision point in month four rather than month twelve, and putting the three scenarios in front of the CFO before the spend starts rather than after it disappoints. It means owning the number, not just producing the chart. For subscription businesses, a SaaS fractional CMO should be building this alongside the CAC payback model, because the two answer different halves of the same question.
If your marketing produces activity but not pipeline, or if you are about to approve a twelve-month budget against an eight-month sales cycle, that is a fixable problem and worth a conversation. If the model shows your acquisition cost cannot be recovered inside a defensible payback window, I will tell you that instead, and you should fix the economics before you hire anyone to spend against them.
About Peter Geisheker
Peter Geisheker is a fractional CMO and the founder and CEO of The Geisheker Group, Inc., serving B2B, B2B SaaS, and PE/VC-backed companies. He has managed more than $50 million in advertising spend and specializes in building capital-efficient, measurable demand generation systems. He also advises private equity portfolio companies on marketing as a value-creation lever. Connect with him on LinkedIn.
References and Sources
- ICONIQ Analytics. “The State of Go-to-Market in 2026.” March 2026. Source of the win rate by opportunity source figures (marketing-sourced 27%, sales-sourced 43%, channel 39%, customer-success-sourced 52%), the sales funnel conversion rates (28% lead to MQL, 30% MQL to SQL, 28% SQL to closed won), the sales cycle by ACV figures, and the 15% to 20% marketing-sourced pipeline share. Survey of 150-plus B2B software companies. https://www.iconiq.com/growth/reports/state-of-go-to-market-2026
- ICONIQ Analytics. “The State of Go-to-Market in 2026,” full report PDF. https://cdn.prod.website-files.com/65d0d38fc4ec8ce8a8921654/69c36701128b86b93599945d_ICONIQ_Analytics%20_The_State_of_GTM_in_2026.pdf
- 6sense. “The B2B Buyer Experience Report for 2025.” November 2025. Source of the 10.1 month average buying cycle, down from 11.3 months, and the point of first contact shifting from 69% to 61% of the buyer journey. Survey of nearly 4,000 B2B buyers across North America, EMEA and APAC. https://6sense.com/science-of-b2b/buyer-experience-report-2025/
- Ebsta and Pavilion. “GTM Benchmark Report 2025.” April 2025. Source of the 36% deal slippage figure for 2025 against 44% for 2024. Analysis of 655,000 opportunities worth $48 billion across 387 companies. https://benchmarks.ebsta.com/hubfs/V3%202025%20Benchmark%20Report/2025_gtm_digest_-_sales_efficiency.pdf
- Ebsta. “B2B Sales Benchmark Report 2024.” February 2024. Source of the finding that win rates fell by 67% in relative terms when deals slipped, particularly beyond eight weeks. Analysis of 4.2 million opportunities across 530 companies. Note that Ebsta states all percentage figures in its reports are relative changes, not percentage points. https://www.ebsta.com/wp-content/uploads/2024/02/B2B-Sales-Benchmarks-2024_.pdf
- Xactly. “2024 Sales Forecasting Benchmark Report.” July 2024. Source of the finding that 52% of sales leaders report forecasts off by 10% or more. Survey of 405 sales and finance respondents in North America, fielded March 2024. Xactly sells forecasting software and has a commercial interest in the finding. https://www.xactlycorp.com/sites/default/files/file/2024-07/2024_sales_forecasting_benchmark_report.pdf
- Gartner. “Gartner Survey Reveals Only 45% of CMOs Surpass Senior Executive Expectations Despite Achieving Objectives.” February 24, 2025. Source of the finding that only 27% of CEOs and CFOs say their CMO exceeded expectations, rising to 45% among CMOs hitting commercial targets. Survey of 125 CEOs and CFOs conducted August to September 2024. https://www.gartner.com/en/newsroom/press-releases/2025-02-24-gartner-survey-reveals-only-45-percent-of-cmos-surpass-senior-executive-expectations-despite-achieving-objectives
- Gartner. “Gartner Survey Finds Only 52% of Senior Marketing Leaders Can Prove Marketing’s Value.” September 18, 2024. Source of the 52% figure and the finding that 47% of CMOs say marketing is viewed as an expense rather than a strategic investment. Survey of 378 senior marketing leaders, April to May 2024. https://www.gartner.com/en/newsroom/press-releases/2024-09-18-gartner-survey-finds-only-52-of-senior-marketing-leaders-can-prove-marketings-value-and-receive-credit-for-its-contribution-to-business-outcomes
- Forrester. “The State Of Business Buying, 2026.” January 21, 2026. Source of the finding that a typical buying decision now includes 13 internal stakeholders and nine external influencers. Based on nearly 18,000 global business buyers. https://www.forrester.com/press-newsroom/forrester-2026-the-state-of-business-buying/
- Bessemer Venture Partners. “Scaling to $100 Million.” Bessemer Atlas, updated July 2025. Source of the CAC payback targets of under 12 months for SMB-focused, under 18 months for mid-market, and under 24 months for enterprise sales motions. Drawn from Bessemer’s cloud portfolio; the source notes it is not a random sample of the private market. https://www.bvp.com/atlas/scaling-to-100-million
- Ehrenberg-Bass Institute for Marketing Science, John Dawes. “Advertising effectiveness and the 95-5 rule: most B2B buyers are not in the market right now.” Produced for the LinkedIn B2B Institute, May 2021. Source of the 95-5 heuristic. Dawes presents it as a heuristic derived from interpurchase intervals rather than a measurement, and recommends computing the figure for your own category. https://marketingscience.info/news-and-insights/advertising-effectiveness-and-the-95-5-rule-most-b2b-buyers-are-not-in-the-market-right-now
- Nielsen. “2025 Marketing ROI Blueprint.” October 9, 2025. Source of the finding that 85% of marketers are confident in their ability to measure ROI while only 32% measure holistically across traditional and digital channels. Nielsen does not publish sample size or fielding dates for this figure. https://www.nielsen.com/news-center/2025/nielsen-unveils-makerting-roi-blueprint/
- The CMO Survey (Duke University Fuqua School of Business, Deloitte and the American Marketing Association). “Highlights and Insights Report,” Spring 2026. Source of the CMO and CFO partnership rating of 4.5 on a 7-point scale, and of marketing budgets at 9.0% of company revenues. Survey of 308 marketing leaders, fielded January 2026. https://cmosurvey.org/wp-content/uploads/2026/04/The_CMO_Survey-Highlights_and_Insights_Report-2026.pdf
- Meta Business Help Center. “About the learning phase.” Documentation of the approximately 50 optimization events per ad set per week that Meta’s delivery system requires before performance stabilizes. https://www.facebook.com/business/help/112167992830700
- Salesforce. “Why the 3x Pipeline Coverage Rule in Sales Is Broken.” Salesforce’s own argument that the 3x convention does not hold up, consistent with the absence of any primary research establishing it. https://www.salesforce.com/blog/pipeline-coverage/
- Benchmarkit. “2025 B2B SaaS Performance Metrics Benchmarks.” 2025. Source of the finding that CAC payback period has increased 12.5% at median since 2022. https://www.benchmarkit.ai/2025benchmarks
- SaaS Capital. “2026 Spending Benchmarks for Private B2B SaaS Companies.” June 10, 2026. Source of the median 8% of ARR spent on marketing and 15% on selling costs. Survey of more than 1,000 SaaS companies, fielded March 2026. https://www.saas-capital.com/blog-posts/spending-benchmarks-for-private-b2b-saas-companies/
- Spencer Stuart. “CMO Tenure 2026: Snapshot of an Expanding Role for Marketing Leaders.” January 2026. Source of the 4.1 year average CMO tenure among S&P 500 companies, based on 346 named CMOs as of June 30, 2025. https://www.spencerstuart.com/research-and-insight/cmo-tenure-2026-snapshot-of-an-expanding-role-for-marketing-leaders
- The Geisheker Group, Inc. “Marketing Revenue Lag Model,” interactive forecast calculator, September 2026. The month-by-month model used throughout this article, with all three scenarios computed live. https://claude.ai/code/artifact/0badd750-fdd7-48a1-b5bb-0df5172524a1
Free Written Growth Plan
Not sure which of your marketing is actually working?
Give us 30 minutes. We will find where your pipeline is leaking and send you a written plan with the three fixes we would test first. Free, no obligation.
No hard sell on the call. Your plan arrives within 3 business days. See a sample plan