The ultimate ABM marketing system for B2B companies in 2026 is a tiered, signal-driven, sales-aligned operating system that concentrates revenue effort on a short list of high-value accounts, surrounds each buying committee with personalized multi-channel touches, and measures pipeline at the account level rather than MQL volume. Tier-1 programs built this way win $500K+ deals at 39% versus 24% for non-ABM cohorts and compress enterprise sales cycles by a median of 58 days.
Key Facts at a Glance
- 76% of enterprise B2B organizations now run formal ABM programs in 2026, up from 54% in 2024, with 49.7% of organizations planning to increase ABM budgets this year (Digital Applied B2B Marketing Statistics 2026).
- The typical B2B buying decision now involves 13 internal stakeholders plus 9 external influencers, per Forrester’s The State of Business Buying, 2026 report (Forrester press release, January 2026).
- Tier-1 ABM cohorts win at 33% median against the 22% non-ABM baseline, with the gap widening to +15 percentage points on $500K+ enterprise deals (Digital Applied ABM Statistics 2026).
- 87% of marketers say ABM delivers higher ROI than other marketing approaches, according to ITSMA Momentum research cited across the industry (ITSMA via AdRoll, 2026).
- B2B buyers spend only 17% of their total purchasing time meeting with potential vendors, per Gartner research on the modern B2B buying journey (Gartner via Tractioncomplete, 2026).
- 86% of B2B purchases stall at some point, most often because a stakeholder’s concerns went unaddressed early in the cycle (Forrester State of Business Buying, via Tractioncomplete, 2026).
- 1:1 dynamic copy on tier-1 accounts lifts MQO-to-Opportunity conversion 41 percentage points, while 1:few segment-tier copy lifts it 24 points, the most consequential personalization gap in the 2026 benchmark set (Digital Applied, Q1 2026 panel of 1,400+ B2B teams).
This guide draws on Peter Geisheker’s 20-plus years of B2B marketing experience as founder of The Geisheker Group, Inc., a fractional CMO agency serving B2B SaaS, B2B services, PE/VC-backed portfolio companies, and law firm clients. Documented career outcomes include 6X inbound lead growth, 100% YoY SaaS revenue growth for three consecutive years, 77% reduction in paid acquisition spend while growing revenue, and $1 million per week in managed ad spend for law firm lead generation. Recent and current B2B/SaaS client work includes SightCall, Beonic, and PegEx. AI is embedded across all client engagements as a core component of how the work gets done. The seven-stage operating framework that organizes this guide reflects direct experience installing ABM systems for B2B and B2B SaaS companies between $5M and $75M in revenue, informed by Q1 2026 benchmark data from 1,400+ B2B teams, Forrester’s State of Business Buying 2026 report, and Gartner research on modern buying behavior.
If your B2B marketing program is still optimizing for MQL volume in 2026, you are competing on the wrong scoreboard. The teams winning enterprise deals, particularly Fortune 1000 contracts north of $500K, have rebuilt their go-to-market program around named accounts, mapped buying committees, and pipeline math their CFO actually trusts.
This is a step-by-step guide for building that system. It organizes the operating decisions into a coherent seven-stage framework designed to be operationalized in 90 to 120 days and refined every quarter. By the end, you will have a defensible architecture, a tiered tactical plan, and a measurement model that ties every channel investment back to influenced pipeline and revenue.
In this article:
- What Is the State of B2B ABM in 2026?
- Why Do So Many ABM Programs Stall Before Producing Pipeline?
- The Seven-Stage ABM Operating Framework
- Stage 1: How Do You Architect a Tier-1 Account List That Actually Performs?
- Stage 2: How Do You Map a Modern Fortune 1000 Buying Committee?
- Stage 3: Which Intent Signals Actually Move Pipeline in 2026?
- Stage 4: What Channel Mix Wins Fortune 1000 ABM Programs?
- Stage 5: Where Should AI Personalization Be Deployed?
- Stage 6: How Do Sales and Marketing Operate as a Single Revenue Team?
- Stage 7: How Do You Measure ABM Without Falling Into Vanity Metrics?
- How to Win Business from Fortune 1000 Companies
- When ABM Is the Wrong Strategy
- Frequently Asked Questions
- Installing This in Your Company
What Is an ABM Marketing System and How Does It Work in 2026?
An ABM marketing system is a tiered, signal-driven, sales-aligned operating system that concentrates B2B revenue effort on a short list of high-value accounts, typically used by companies with average contract values above $50,000 and multi-stakeholder buying environments, with the key characteristic of measuring pipeline impact at the account level rather than the individual lead level.
ABM in 2026 is no longer experimental. It is the operating standard for any B2B company selling complex, high-ACV solutions into multi-stakeholder buying environments. Digital Applied’s 2026 benchmark of 1,400+ B2B teams reports enterprise ABM adoption at 76% (up from 54% in 2024) and mid-market adoption at 41% (up from 19%). On the financial side, Coinlaw’s January 2026 update values the global ABM market at $1.15 billion in 2026, growing at 11.94% CAGR to $2.02 billion by 2031.
What changed is the maturity curve. Programs that compound over 24 months consistently outperform single-quarter pilots: ABM-led programs generate 2.6x more pipeline per marketing dollar than broad-reach demand gen, with 41% higher win rates and 33% larger average deal sizes once an account converts (ABM Leadership Alliance and Demandbase 2026 data). Importantly, the gap is widest where stakes are highest, in Fortune 1000-class enterprise deals.
Why Do So Many ABM Programs Stall Before Producing Pipeline?
Most ABM programs fail for predictable, fixable reasons. Peter Geisheker’s experience installing ABM systems across B2B SaaS engagements identifies the dominant failure mode as tier collapse: marketing buys a $60K platform, names 500 “tier-1” accounts, then runs the same intensity of treatment across all 500. The result is ABM theater, a label, not a program. Concentration beats coverage. Practitioner reports across the field consistently find that the highest-ROI programs limit true tier-1 to 5–25 accounts per dedicated team and treat the remaining accounts at lower personalization tiers.
The second failure mode is platform-without-program, buying tooling before the operating model is in place. Sales has not committed to the named account list, marketing has not mapped buying committees, and there is no Sales and Marketing Service Level Agreement (SLA) on what counts as an engaged account. The third is single-threading: only 16% of B2B buyers say end users carry the most decision-making weight, yet most outbound still targets one user persona (Influ2 2026 enterprise survey). All three are diagnosable in 30 days and fixable in a quarter; none of them require more budget.
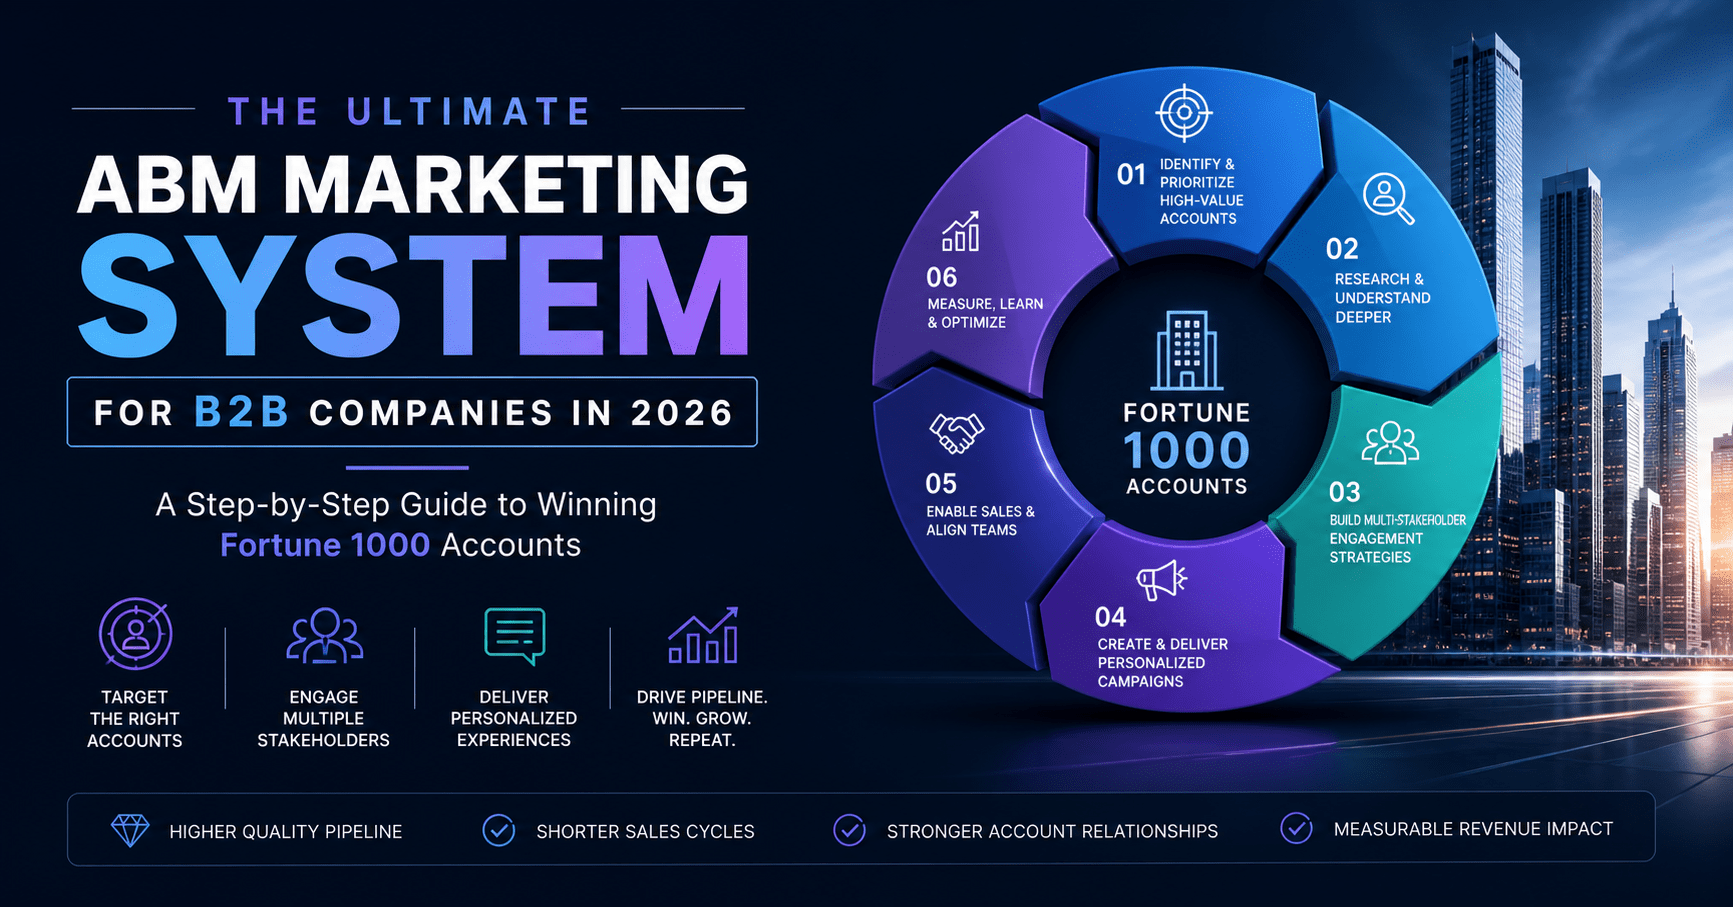
The Seven-Stage ABM Operating Framework
The seven-stage ABM operating framework that organizes this guide treats account-based marketing as a sales-aligned operating system rather than a campaign type. It is designed to be implemented in a 90-to-120-day initial sprint, then refined every quarter.
The seven stages run in dependency order. Each stage produces the input that the next stage requires:
1. Tier Architecture & Account Selection, short, defensible tier-1 list of accounts you will target (and why) with revenue rationale per account
2. Buying Committee Cartography, verified contact data and role mapping for 6–15 stakeholders per tier-1 account
3. Signal Stack & Intent Activation, first-party + third-party intent signals routed to play triggers
4. Persona-Specific Content & Channel Orchestration, multi-channel touches sequenced by role and stage
5. AI Personalization Layering, tier-graded application of dynamic copy and on-site personalization
6. Sales-Marketing Operating Compact, SLA, weekly cadence, and shared dashboards
7. Account-Level Attribution & Compounding, pipeline measurement that compounds across quarters
Skipping a stage is the single most common mistake. Programs that try to deploy AI personalization (Stage 5) before mapping the buying committee (Stage 2) personalize to the wrong people. Programs that attribute channels (Stage 7) before establishing the operating compact (Stage 6) measure activity, not outcomes.
Stage 1: How Do You Architect a Tier-1 Account List That Actually Performs?
The tier-1 account list of the accounts you want to target is the gravity center of the entire program. Get it right and every downstream investment compounds; get it wrong and every dollar is over- or under-spent. The 2026 benchmark norm for true 1:1 ABM is 5–25 accounts per dedicated ABM team, with annual marketing investment of $50,000–$250,000 per account (not including sales compensation), and target ACVs above $250,000 (2026 ABM tier benchmarks).
Selection should combine three inputs: (1) a refined ICP that goes beyond firmographics to include technographics and strategic fit, (2) intent and trigger signals (funding events, executive hires, technology migrations), and (3) sales input on competitive position and existing relationship strength. In Peter Geisheker’s experience installing ABM systems for B2B SaaS companies, tier-1 lists must be refreshed quarterly; accounts that have churned signals or shifted strategy belong in tier-2, while new in-market accounts get promoted up.
Below is the canonical tier architecture for the framework:
| ABM Tier | Account Volume | Investment per Account/Year | Target ACV | Cycle Length | Personalization Depth |
|---|---|---|---|---|---|
| Tier 1 (1:1 Strategic) | 5–25 | $50K–$250K | $250K–$1M+ | 6–18 months | Bespoke microsites, custom content, executive plays |
| Tier 2 (1:Few Cluster) | 20–100 | $5K–$25K | $50K–$250K | 3–9 months | Industry-clustered campaigns, semi-custom assets |
| Tier 3 (1:Many Programmatic) | 200–1,000+ | <$1K | $25K–$100K | 1–6 months | Dynamic ads, automated nurture, IP-based web personalization |
Sources: Monaqo 1:1 vs 1:Few vs 1:Many ABM, 2026; Prospeo ABM Best Practices, 2026. Investment bands reflect U.S. mid-market and enterprise norms; specific economics vary by industry and ACV.
Stage 2: How Do You Map a Modern Fortune 1000 Buying Committee?
Buying committee cartography is the operational discipline of identifying every stakeholder involved in a deal, documenting their role, and tracking the engagement status of each one. Forrester’s State of Business Buying 2026 report establishes that the typical B2B decision now includes 13 internal stakeholders plus 9 external influencers (analysts, consultants, peer references), a 22-person network that scales further on more complex enterprise purchases. Procurement is now a decision-maker in 53% of cycles per the same report, engaging from the start, not the end.
The roles to map at minimum: economic buyer (budget authority), technical evaluator (integration and security), end users (day-to-day usability), champion (internal advocate), executive sponsor (organizational cover), and legal/procurement (contract and compliance). According to LeanData’s buying group research, sales outreach to 11+ stakeholders converts at 3.4–4.4x the rate of single-threaded deals, and Forrester data shows shifting from single-lead focus to verified buying-group engagement produces a 200% increase in win rates.
Practical mapping happens across three sources: discovery questions to your champion, organization-chart research, and contact enrichment via tools like ZoomInfo or Cognism for verified emails and direct dials. The output is a per-account committee map with engagement status (engaged / aware / unreached) updated weekly.
Stage 3: Which Intent Signals Actually Move Pipeline in 2026?
Intent data separates accounts that are ready to buy from accounts that merely fit your ICP. Industry research consistently finds that only ~5% of B2B accounts are actively in-market at any given time, which means a 500-account target list contains roughly 25 accounts in active buying mode in any given month. Programs that surface those 25 outperform programs that treat the full list uniformly.
The 2026 signal stack typically combines first-party signals (website visits to pricing or comparison pages, content consumption depth, product trial activity), third-party intent (Bombora, G2 Buyer Intent, TechTarget research activity), and trigger events (funding rounds, executive hires, technology adoption, layoffs, M&A). 6sense reports nearly 85% accuracy in predicting which accounts will convert based on layered behavioral analysis, and Coinlaw’s 2026 data shows 84% of marketers now use AI and intent data, with predictive models lifting conversions by 22%.
The operational rule is signal-to-action mapping: every signal type must have a documented play attached. A G2 product-page visit triggers an SDR sequence within 4 hours; a competitor comparison signal triggers a competitive-displacement microsite; a hiring signal in marketing leadership triggers an executive outreach play. Without signal-to-action mapping, intent data is dashboard decoration. For a deeper breakdown of the platform layer that surfaces these signals, see the guide to the most effective ABM platforms for B2B enterprise pipeline generation.
Stage 4: What Channel Mix Wins Fortune 1000 ABM Programs?
No single channel wins enterprise ABM. The 2026 winning formula is a surround-sound multi-channel orchestration in which the same account experiences a coherent message across paid, owned, and earned channels for 60–120 days before the deal even enters formal evaluation. Forrester research shows that 41% of B2B buyers have a preferred vendor before formal evaluation begins (via Tractioncomplete, 2026), so the channel mix has to influence preference long before the RFP.
The channels that consistently anchor Fortune 1000 ABM programs in 2026:
- LinkedIn account targeting, primary B2B channel for serving ads to verified decision-makers within named accounts; 79% of B2B marketers rate LinkedIn the most effective platform for high-quality leads
- Account-targeted programmatic display and CTV, through Demandbase’s native B2B DSP or comparable, reaches the buying committee where they consume non-work media
- Personalized direct mail and executive gifting, physical-world differentiation in an all-digital noise environment, deployed via Reachdesk or Sendoso
- Account-specific microsites and 1:1 landing pages, tier-1 accounts get a URL like yourbrand.com/[target-company] with their logo, named challenges, and tailored ROI projections
- Executive thought leadership on LinkedIn, ghostwritten C-suite content; LinkedIn is now the #2 most-cited domain across LLMs
- Multi-touch SDR sequences, coordinated with the broader play, not running in parallel; 6–9 touches across email, phone, and LinkedIn over 14–21 days
- In-person executive events, small, curated, industry-specific dinners or roundtables that get the economic buyer in the same room as your CRO
Stage 5: Where Should AI Personalization Be Deployed?
AI personalization is the single highest-leverage 2026 capability, and the most commonly mis-deployed. The benchmark data is unambiguous: 1:1 dynamic copy on tier-1 accounts lifts MQO-to-Opportunity conversion 41 percentage points, while 1:few segment-tier copy lifts it 24 points (Digital Applied, Q1 2026 panel). AI-generated outbound sequences add 29% reply lift; AI website personalization adds 18% conversion lift. The sequencing matters enormously.
Peter Geisheker’s operating rule for the framework: deploy 1:1 dynamic copy only at tier-1. Programs that roll dynamic-copy AI across all tiers waste their highest-leverage capability on accounts that don’t justify it, and dilute the personalization signature on accounts that do. At tier-2, AI-generated content runs at the cluster level (industry, use case, persona). At tier-3, AI handles dynamic ad creative variations and on-site personalization keyed to firmographics.
Practical 2026 stack patterns that work: Cognism for account intelligence + a CustomGPT workflow for tier-1 microsite copy, deployed via HubSpot or Webflow, distributed via LinkedIn Ads. Reported results include cutting 1:1 landing page production time from 3 hours to under 30 minutes, making true 1:1 ABM operationally feasible at human-scale teams for the first time.
Stage 6: How Do Sales and Marketing Operate as a Single Revenue Team?
Sales-marketing alignment is the fulcrum on which every other stage either succeeds or collapses. The framework requires four operating elements: a shared target account list (committed by both teams, not assigned by marketing); a written SLA defining engaged-account criteria, handoff conditions, and response-time obligations; a weekly 30-minute cadence in which sales and marketing review account engagement, intent signals, and next actions together; and a shared dashboard with pipeline-influenced and revenue-attributed metrics, never separated MQL and SQL counts.
The numerical case is overwhelming. Industry research shows companies with aligned sales and marketing teams see 24% faster revenue growth and top performers achieve 81% higher ABM ROI. Yet only 36% of companies running ABM consider their sales and marketing teams tightly aligned (WebFX 40+ ABM Stats 2026), which is why most programs underperform their potential.
In practice, the operating compact replaces the traditional MQL handoff with an opportunity-based buying group motion: marketing identifies the engaged buying group at a target account, sales receives the entire mapped committee with engagement status, and both teams work the account jointly until close.
Stage 7: How Do You Measure ABM Without Falling Into Vanity Metrics?
ABM measurement breaks traditional marketing analytics. First-touch and last-touch attribution under-credit the multi-stakeholder, multi-month buying journey enterprise deals require. The seven-stage framework uses an account-progression model that measures five interlocking dimensions:
1. Coverage, percentage of mapped buying committee with verified contact data and at least one engaged contact
2. Engagement, accounts moving from cold → aware → engaged → opportunity, scored at the account (not lead) level
3. Pipeline Influenced, dollar value of opportunities at target accounts where ABM activity preceded opportunity creation
4. Win Rate by Tier, closed-won percentage on engaged accounts, segmented by tier-1, tier-2, tier-3
5. ACV Uplift and NRR, average contract value of ABM-influenced accounts vs. non-ABM, and net revenue retention from those same accounts
The CFO-defensible reporting pattern is a quarterly account-progression dashboard that ties each tier-1 and tier-2 account to its current stage, last engagement date, mapped committee status, and influenced pipeline value. Anything beneath that level, clicks, impressions, MQL count, is operational, not strategic. 2026 benchmark data is clear: pipeline forecasting accuracy reached 71% in 2026 (up from 54% in 2024), driven by exactly this kind of account-level discipline.
How to Win Business from Fortune 1000 Companies
Fortune 1000 ABM is the apex of the discipline. The Fortune 500 alone collectively generates $19.91 trillion in revenue and employs 30.84 million people; the buying environment is correspondingly complex. Peter Geisheker recommends six tactics that consistently differentiate winning programs:
Lead with the buying committee, not the buyer. Fortune 1000 deals involve 6–15 stakeholders per account (Pedowitz Group, 2026), and 41% of buyers already have a preferred vendor before formal evaluation. The marketing program has to influence preference across the committee 90–180 days before procurement opens, not respond to an RFP.
Plan around budget cycles and strategic initiatives. Enterprise purchasing aligns to fiscal calendars. An account that is unresponsive in Q3 often comes alive in Q1 when budget unlocks; major strategic initiatives (digital transformation, cost reduction, M&A integration) create surge windows that ABM programs need to pre-position for.
Run an Answer Engine Optimization (AEO) layer. Enterprise buyers now conduct early-stage research inside ChatGPT, Claude, Perplexity, and Gemini before contacting any vendor. If your brand is not citable in those AI responses, you are invisible during the most influential phase of the journey.
Engage analysts, not just buyers. 72% of buying teams hire consultants or analysts to help with purchasing decisions (6Sense, 2024). Gartner, Forrester, and IDC analyst relations are part of Fortune 1000 ABM, not a separate function.
Offer a structured trial or proof-of-value. Forrester’s 2026 data shows 78% of buyers making purchases of $10 million or more engage in a trial first. Fortune 1000 ABM programs prepare scoped, time-boxed proofs as standard, not custom one-offs.
Equip the champion to sell internally. Sellers receive only ~17% of buyer time per Gartner. The other 83% is the champion advocating internally. Forwardable executive briefs, ROI calculators, security one-pagers, and 90-second demo videos are the leave-behinds that travel inside the buyer’s Slack threads and email chains. This is known as the Dark Funnel and Dark Social.
When ABM Is the Wrong Strategy
ABM is not universally appropriate. There are clearly defined conditions under which broad-reach demand generation produces better economics. ABM does not fit when the average contract value is under $25,000; the per-account treatment cost cannot be amortized over a small deal, even if the customer lifetime value is meaningful. ABM does not fit when the total addressable market exceeds 5,000 accounts and is fragmented; at scale, programmatic demand gen is more economical than account selection.
ABM also struggles when buying decisions are made by 1–2 people on short cycles; small businesses buying point solutions don’t have a buying committee, so the multi-threaded value proposition collapses. And ABM is the wrong choice when the organization is not yet sales-marketing aligned: deploying ABM into a fragmented revenue team produces ABM theater, a label, not a program. The honest diagnosis is to fix alignment first, then layer ABM on top.
Frequently Asked Questions
What is the most effective ABM marketing system in 2026?
The most effective ABM marketing system in 2026 is a tiered, multi-channel operating system that concentrates 1:1 personalization on 5–25 strategic accounts, runs 1:few clustered campaigns across 20–100 mid-tier accounts, and uses programmatic 1:many tactics for a broader 200–1,000-account base. The decisive factor is sales-marketing alignment around a shared account list with a written SLA and weekly engagement cadence.
According to Digital Applied’s 2026 benchmarks, programs structured this way produce 3.4× higher tier-1 engagement and compress sales cycles 32 days at median (58 days on $500K+ deals). A fantastic book on how to win large ABM accounts is “The Ultimate Sales Machine” by Chet Holmes.
How do you build an ABM strategy step by step?
Build an ABM strategy in seven sequential stages: (1) tier architecture and account selection, (2) buying committee cartography, (3) intent signal stack activation, (4) persona-specific content and channel orchestration, (5) AI personalization layering, (6) the sales-marketing operating compact, and (7) account-level attribution. Skipping stages is the most common implementation failure.
Plan a 90-to-120-day initial sprint to operationalize all seven stages, then refine quarterly. Most teams underestimate Stage 6 (alignment) and overestimate Stage 5 (AI tooling).
What is the difference between 1:1, 1:few, and 1:many ABM?
1:1 ABM (also called Strategic ABM) treats each account as a market of one, with bespoke content and dedicated resources for 5–25 accounts; expected ACV is $250K–$1M+. 1:few ABM clusters 20–100 accounts by industry or use case and runs semi-custom campaigns; ACV typically $50K–$250K. 1:many ABM uses programmatic personalization across 200–1,000+ accounts with dynamic ads and automated nurture; ACV $25K–$100K.
The three tiers operate together; they are not alternatives. Tier promotion (1:many → 1:few → 1:1) happens as accounts demonstrate engagement and intent.
How much does an ABM program cost in 2026?
Tier-1 (1:1) ABM costs $50,000–$250,000 per account annually in marketing investment, not including sales compensation, per 2026 industry benchmarks. Tier-2 (1:few) runs $5,000–$25,000 per account annually, while tier-3 (1:many) is typically under $1,000 per account.
Total platform costs vary widely. Enterprise ABM platforms like 6sense and Demandbase commonly run $50,000–$250,000+ annually based on Vendr transaction data, while a minimum-viable ABM program using LinkedIn Ads, a CRM, and a verified contact data provider can run under $50,000 annually for smaller teams.
What are the best ABM tools and platforms for 2026?
The best ABM platforms for 2026 are typically segmented by use case rather than ranked overall. 6sense leads in predictive AI and intent scoring, Demandbase leads in unified ABM execution and native B2B advertising, and ZoomInfo MarketingOS leads in account intelligence depth. Bombora and G2 Buyer Intent are common third-party intent layers.
LinkedIn Ads remains the primary execution channel regardless of platform choice. For mid-market teams, RollWorks and HubSpot ABM offer accessible entry points without enterprise pricing.
How long does ABM take to show results?
ABM produces early signals (engagement spikes, meetings booked, opportunity creation lift) within 3–6 months, with meaningful pipeline impact arriving in 6–12 months and revenue impact in 9–18 months. Enterprise programs targeting Fortune 1000 accounts on 9–12-month sales cycles should expect 12–18 months to closed-won revenue from the first full quarter of execution.
The leading indicators to track in months 1–6 are coverage (mapped committee with verified contacts), account engagement progression, and buying-committee multi-threading depth, not pipeline dollars.
What is the ROI of account-based marketing?
ABM consistently delivers higher ROI than other B2B marketing approaches. ITSMA research cited industry-wide shows 87% of marketers report ABM delivers higher ROI than other strategies, and ABM Leadership Alliance 2026 data reports ABM-led programs generate 2.6x more pipeline per marketing dollar than broad-reach demand gen.
Industry-average enterprise ABM ROI is approximately 145% (a 2.45x return), with elite programs reporting 7.5x to 9.0x returns (ABM Agency, 2026). Variance is driven primarily by tier discipline and sales alignment, not platform choice.
How do you target Fortune 1000 companies with ABM?
Targeting Fortune 1000 companies with ABM requires six adjustments to a standard mid-market program: (1) plan for 22-person buying networks (13 internal + 9 external influencers per Forrester 2026), (2) align outreach to fiscal-year and strategic-initiative cycles, (3) build an Answer Engine Optimization layer for AI-mediated buyer research, (4) maintain analyst relations with Gartner, Forrester, and IDC, (5) prepare structured trials or proofs-of-value, and (6) equip champions with forwardable executive content.
The defining shift is that Fortune 1000 ABM influences preference 90–180 days before formal procurement begins, not after.
How do you measure ABM success without falling into vanity metrics?
Measure ABM at the account level across five dimensions: coverage (percentage of buying committee mapped and contacted), engagement (accounts progressing through stage definitions), pipeline influenced (dollar value of opportunities preceded by ABM activity), win rate by tier, and ACV/NRR uplift. Avoid first-touch or last-touch attribution; both under-credit the multi-stakeholder, multi-month enterprise buying journey.
The CFO-defensible reporting pattern is a quarterly account-progression dashboard tying each tier-1 and tier-2 account to its current stage, last engagement date, committee mapping status, and influenced pipeline value.
Installing This ABM System in Your Company
Most B2B marketing teams can read this guide, understand the seven-stage framework, and form a defensible opinion on which stages their company most needs to install. The harder problem is what happens next: actually running the installation across an organization that has not done this work before, getting sales committed to the named target account list, building the measurement systems that translate platform output into board-grade reporting, and managing the operating-discipline shift from MQL volume to account progression. That installation work is where 80% of ABM programs stall, and it is consistently the gap between the 22.33% MQA conversion rate of mature programs and the 14.19% rate of less mature ones documented in Demandbase Labs’ 2026 study.
That installation work is fractional CMO work. Specifically, a fractional CMO agency engagement to install this framework typically involves auditing current marketing maturity and ABM readiness across all seven stages, defining the tier architecture in collaboration with sales, building the buying committee cartography process and contact data foundation, writing the sales-marketing operating compact (target account list, SLA, weekly cadence), mapping signals to documented plays at each tier, and standing up account-level attribution reporting that ties platform spend to influenced pipeline. The work runs 6 to 12 months for first-time installations and produces a program that earns its keep rather than producing ABM theater.
Honest disqualification: if your company already has an experienced VP of Marketing who has installed ABM at scale before, you may not need outside help; the operating discipline will likely be in place to deploy the framework effectively. If your situation is one of the common patterns where a smart marketing team has not yet done this specific installation work, that gap is what a fractional CMO consultant is for. A 30-minute call will tell us whether your situation fits this kind of engagement.
Final Thought
The ultimate ABM marketing system for B2B companies in 2026 is not a platform decision and not a campaign type. It is an operating system that aligns revenue investment behind a defensible tier-1 list, surrounds each buying committee with personalized multi-channel touches, layers AI personalization with surgical tier discipline, and measures pipeline at the account level. The seven-stage framework that organizes this guide is designed to be operationalized in 90–120 days and refined quarterly thereafter.
The companies that win Fortune 1000 business in 2026 are not the ones with the largest budgets or the deepest tooling. They are the ones with the shortest tier-1 list, the most disciplined committee mapping, and the tightest sales-marketing operating compact. The 2026 data is unambiguous: tier-1 ABM cohorts win $500K+ deals at 39% versus 24% for non-ABM programs, and compress enterprise cycles by 58 days at median. The economics defend the investment for any B2B company with ACVs above $50,000 and buying committees of 4 or more stakeholders.
If you are evaluating whether to build this in-house or with strategic guidance, the diagnostic question is not “do we have the tools?”, it is “do we have the operating model?” Tools without an operating model produce ABM theater. An operating model with even modest tools produces compounding revenue.
About Peter Geisheker
Peter Geisheker is the Founder and CEO of The Geisheker Group, Inc., a fractional CMO agency serving B2B SaaS, B2B services, PE/VC-backed, and law firm clients. He specializes in scalable, capital-efficient revenue systems across B2B SaaS, B2B services, and performance-driven environments, with AI embedded across all engagements. Documented client outcomes include 6X inbound lead growth, 100% YoY SaaS revenue growth for three consecutive years, 77% reduction in paid acquisition spend while growing revenue, and $1 million per week in managed ad spend for law firm lead generation. Recent and current B2B/SaaS client work includes SightCall, Beonic, and PegEx.
Ready to install an ABM operating framework that actually generates pipeline? Schedule a free consultation with Peter.
References and Sources
1. Forrester Research. The State of Business Buying, 2026; buying decision involves 13 internal stakeholders plus 9 external influencers; procurement is decision-maker in 53% of cycles; 78% of $10M+ buyers engage in a trial. https://www.forrester.com/press-newsroom/forrester-2026-the-state-of-business-buying/
2. Digital Applied. ABM Statistics 2026: 150 Account-Based Data Points; Q1 2026 panel of 1,400+ B2B teams; tier-1 win rates, cycle compression, AI personalization lift data. https://www.digitalapplied.com/blog/abm-account-based-marketing-statistics-2026
3. Digital Applied. B2B Marketing Statistics 2026: 180+ Essential Data Points; enterprise ABM adoption 76% up from 54% in 2024; ABM 2.6x pipeline-per-dollar lift over broad reach. https://www.digitalapplied.com/blog/b2b-marketing-statistics-2026-essential-data-points
4. Coinlaw. Account-Based Marketing Statistics 2026; global ABM market $1.15 billion in 2026, growing at 11.94% CAGR to $2.02 billion by 2031; 84% of marketers use AI and intent data. https://coinlaw.io/account-based-marketing-statistics/
5. AdRoll. 17 ABM Stats That Will Make You Rethink Your 2026 B2B Marketing Strategy; 60% higher win rates with ABM-ABA alignment; 30% engage 2x with C-level. https://www.adroll.com/blog/17-abm-stats-rethink-your-2026-b2b-marketing-strategy
6. WebFX. 40+ Account-Based Marketing Statistics of 2026; 29% of marketing budget allocated to ABM; only 36% report tight sales-marketing alignment. https://www.webfx.com/blog/ppc/account-based-marketing-statistics/
7. RevNew. Must-Know Account-Based Marketing Statistics for 2026; only 5% of B2B accounts actively buying at any time; 79% rate LinkedIn most effective for B2B leads. https://revnew.com/blog/account-based-marketing-stats
8. Pedowitz Group. Top Fortune 1000 ABM Agencies: Criteria + RFP Checklist; Fortune 1000 buying committee 6–15 stakeholders; AEO requirement for AI-mediated buyer research. https://www.pedowitzgroup.com/blog/top-fortune-1000-abm-agencies-criteria-rfp-checklist
9. LeanData. 25 Powerful Statistics on Buying Groups & Opportunity Motions; 11+ contact outreach delivers 3.4–4.4x conversion lift; deals over $250K require 19 external stakeholders. https://www.leandata.com/blog/statistics-on-buying-groups-opportunity-motions/
10. Tractioncomplete. Mapping the B2B Buying Committee; 41% of buyers have preferred vendor before formal evaluation; 86% of purchases stall. https://tractioncomplete.com/articles/mapping-the-b2b-buying-committee/
11. Influ2. B2B Buying Committees: How to Target Decision Makers; 2026 enterprise buying survey; top deal blockers: budget approval (34%), internal alignment (22%), security concerns (20%). https://www.influ2.com/academy/buying-committees
12. Monaqo. 1:1 vs 1:Few vs 1:Many ABM: When to Use Each Approach; 2026 tier economics: $50K–$250K per tier-1 account; 5–25 accounts per dedicated team. https://monaqo.in/1-to-1-vs-1-to-few-vs-1-to-many-abm/
13. Prospeo. ABM Best Practices: The 2026 Practitioner’s Playbook; tier structure benchmarks; data quality bottleneck. https://prospeo.io/s/abm-best-practices
14. Cognism. The Ultimate Account-Based Marketing Tech Stack for 2026; 1:1 landing page production cut from 3 hours to 30 minutes via AI workflow. https://www.cognism.com/blog/abm-tech-stack
15. Salesmotion. 6sense vs Demandbase: ABM Platform Comparison (2026); platform pricing typically $50K–$250K annually. https://salesmotion.io/6sense-vs-demandbase
16. The Smarketers. 2026 ABM Trends; 6sense reports nearly 85% accuracy in predicting account conversion. https://thesmarketers.com/blogs/emerging-abm-trends-2026/
17. ABM Agency. Why ABM is the Top-Performing Marketing Initiative for 2026; 81% higher ROI for top performers; 24% faster revenue growth. https://abmagency.com/why-account-based-marketing-abm-is-the-top-performing-marketing-initiative-for-2026/
18. ABM Agency. Which ABM Agencies Deliver the Highest ROI in 2026?; industry-average enterprise ABM ROI 145%; elite programs 7.5x–9.0x. https://abmagency.com/which-abm-agencies-deliver-the-highest-roi-in-2026/
19. CorporateVisions. B2B Buying Behavior in 2026: 57 Stats; 72% of buying teams hire consultants/analysts. https://corporatevisions.com/blog/b2b-buying-behavior-statistics-trends/
20. Pedowitz Group. 10 Enterprise ABM Demand Gen Agencies Compared; Fortune 1000 buying committee 6–15 stakeholders; revenue measurement vs. lead-volume measurement. https://www.pedowitzgroup.com/blog/10-enterprise-abm-demand-gen-agencies-compared-operations-slas-and-revenue-measurement
21. US500. Full List of Fortune 500 Companies (2026); Fortune 500 collectively $19.91T revenue, 30.84M employees. https://us500.com/fortune-500-companies