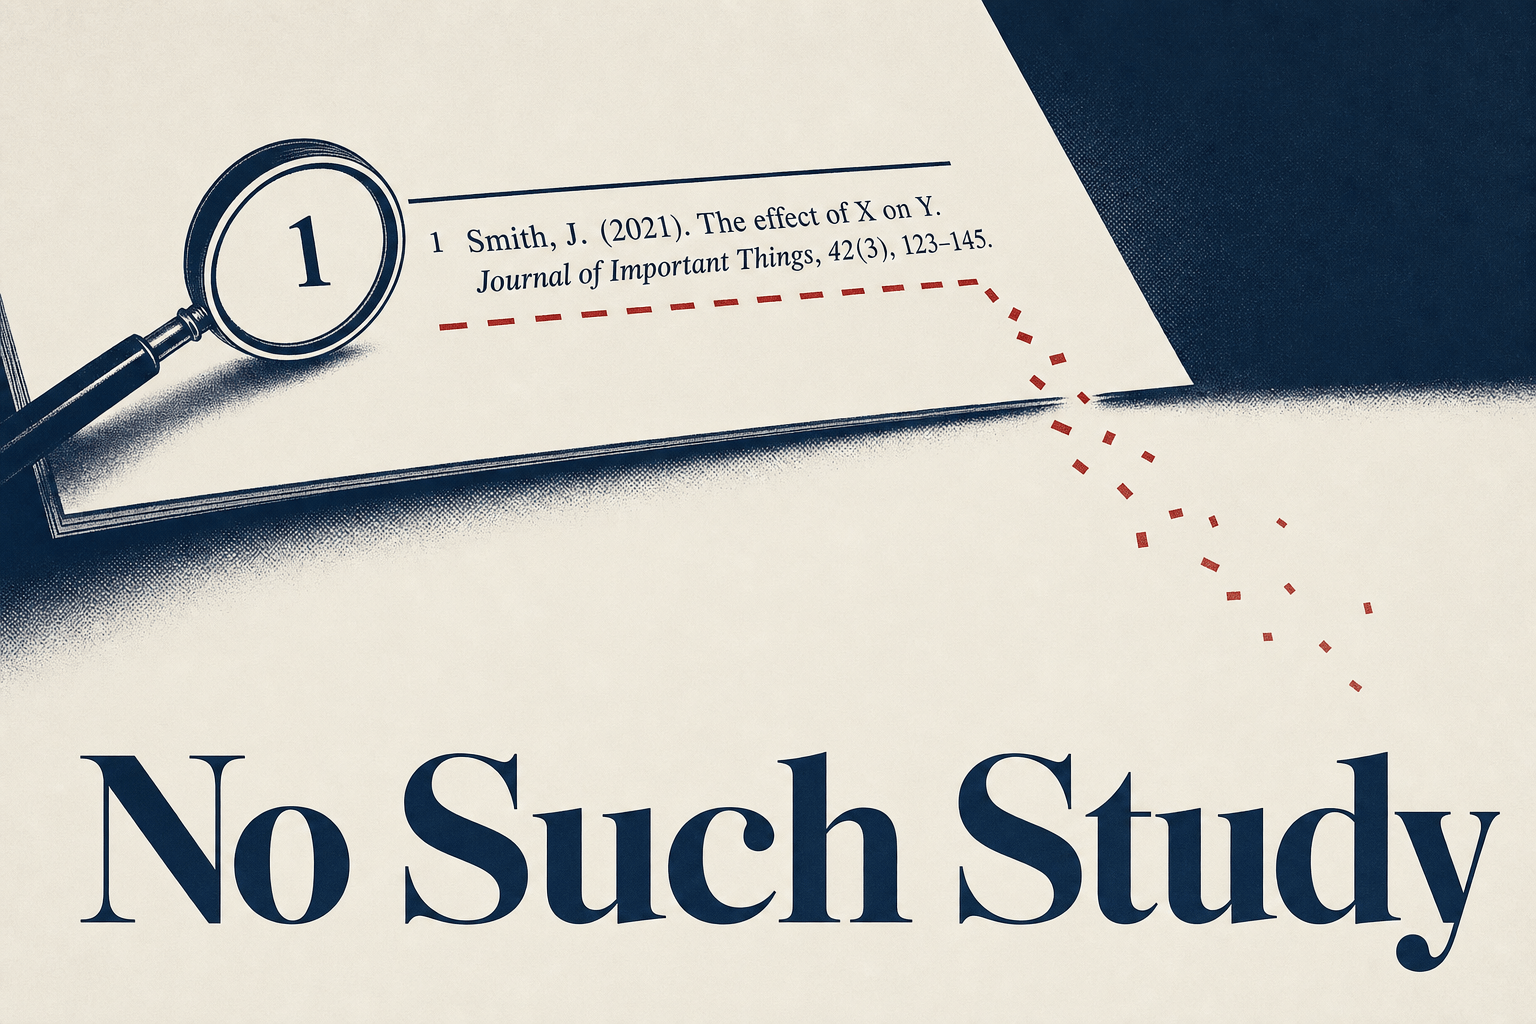
Bottom line: The widely circulated claim that companies using fractional CMOs grow revenue 29% versus 19% without one is fabricated; no primary study produces those figures, and the number is credited to at least five different origins across the web, including, wrongly, to The Geisheker Group. A laundered statistic is a number that has been repeated across enough websites to acquire a plausible-sounding source it never actually had. In August 2026 an audit of all 168 pages on this site found nineteen instances of laundered statistics published here, and this article documents what was found, how it happened, and how a buyer can check any marketing statistic in under a minute.
Key Facts at a Glance
- An audit of all 168 URLs in this site’s sitemaps on August 30, 2026 found 19 instances of unsourceable statistics across 6 pages; all 19 have been removed (first-party audit data, The Geisheker Group).
- The “29% versus 19%” fractional CMO growth claim appears across the web credited to Harvard Business Review, Harvard Business School, SingleGrain, Integrate.io, and The Geisheker Group. Five conflicting origins for one number is the signature of laundering, not of research.
- Eight leading AI search tools returned incorrect citations in more than 60% of 1,600 test queries; the best performer was wrong 37% of the time and the worst 94% of the time (Tow Center for Digital Journalism, Columbia Journalism Review, March 2025).
- More than half of the citations produced by two of those tools led to fabricated or broken URLs, and premium versions produced more confidently incorrect answers than free ones (Tow Center for Digital Journalism, 2025).
- Average CMO tenure at S&P 500 companies is 4.1 years, the shortest run of any core C-suite seat (Spencer Stuart CMO Tenure Study, January 2026).
- Marketing budgets fell to 9.0% of company revenues in 2026, and when profits miss expectations marketing is cut 45.4% of the time, more often than any other expense category (The CMO Survey, Duke University Fuqua School of Business with Deloitte and the AMA, 35th edition, 2026).
- Among 3,810 interim leaders surveyed, 85% have worked independently for more than a year, and new entrants to the market rose from 6% in 2020 to 15% in 2025 (Heidrick & Struggles Talent Lens Survey, 2026).
This article draws on Peter Geisheker’s 20-plus years of B2B marketing experience as founder and CEO of The Geisheker Group, Inc., a fractional CMO agency serving B2B, B2B SaaS, PE/VC-backed, and law firm clients. Documented client outcomes include 6X inbound lead growth, 100% year-over-year SaaS revenue growth for three consecutive years, a 77% reduction in paid acquisition spend while revenue grew, and $1 million per week in managed ad spend for law firm lead generation. Unlike most content in this category, the central evidence below is first-party: it is an audit of this firm’s own website, including the errors found on it. Peter and Michael Pecora lead engagements together as embedded senior marketing executives, and the diligence standard described here is the one applied inside client engagements.
Table of Contents
- Is the 29% fractional CMO revenue growth statistic real?
- How does a fabricated marketing statistic spread?
- What happened when the number reached my own website?
- Why did every editorial check miss it?
- What does AI do to a laundered statistic?
- How do you check a marketing statistic in under a minute?
- What should you ask a fractional CMO about their numbers?
- Frequently Asked Questions
- Implementing this standard in your company
- About Peter Geisheker
- References and Sources
Explore Fractional CMO Services →
Is the 29% fractional CMO revenue growth statistic real?
No. If you have researched hiring a fractional CMO at any point in the last two years, you have almost certainly read some version of this sentence: companies that use fractional CMOs see average revenue growth of 29%, compared with 19% for companies that do not. It appears on dozens of agency websites. It appears in pitch decks. It has been quoted back to me by prospects.
There is no such study. The figure is attributed, depending on which page you land on, to Harvard Business Review, to Harvard Business School, to the agency SingleGrain, to a data-pipeline software vendor called Integrate.io, to C Suite Network, and, on at least one competitor’s site, to The Geisheker Group. Five or more conflicting origins for a single number is not a citation problem. It is the diagnostic signature of a statistic that was never measured by anyone.
That matters here for a specific reason, which is why this article exists rather than a general essay about sourcing.
The fractional CMO category is unusually exposed to this, and Peter Geisheker has been direct about why for some time:
“The title fractional CMO has no barrier to entry. There is no credential, no licensing body, and nothing a buyer can verify from a website, so the quality range is enormous. I have sat in peer groups of working fractional CMOs and been genuinely surprised by how thin the technical knowledge was, on campaign mechanics, A/B testing, conversion optimization, SEO. There is a large difference between telling somebody to go run a Facebook campaign and knowing, step by step and with current techniques, how it is actually done.”
A category with no credential and nothing verifiable from a website is a category where a made-up growth statistic has nothing to bump against. Nobody is checking, because there is no body whose job it is to check. That is the condition this number grew in, and it is the same condition a buyer is operating in when they try to hire a fractional CMO from a shortlist of websites that all look equally confident.
How does a fabricated marketing statistic spread?
The mechanism is mundane, which is what makes it durable.
Someone writes a number without a source, or with a vague one. A second writer, researching the topic by searching for “fractional CMO statistics,” finds it and needs a citation, so they attach the most authoritative-sounding name in the vicinity. Harvard Business Review is a popular choice because it is plausible for almost any business claim. A third writer finds the second version, now carrying an HBR credit, and repeats it in good faith. By the fourth or fifth iteration the number has a source, a year, and a decimal point, and it looks exactly like research.
Search rewards this. Query any “[category] statistics” phrase and the top results are aggregator pages built specifically to rank for it, which is to say pages assembled by the same process. Sourcing a statistic by searching for it does not sample the research literature; it samples the aggregation layer sitting on top of the research literature. Any editorial process that trusts search results reproduces this failure every single time, no matter how careful the writer is.
Two consequences follow, and the second is the one nobody plans for. The number keeps spreading. And it acquires new origins as it goes, because each writer credits whoever seems most likely, which means recognizable entities in the category eventually get named as the source of research they never conducted.
What happened when the number reached my own website?
It reached mine. That is the uncomfortable part, and it is the reason this article is worth more than a lecture about sourcing hygiene.
In August 2026 I ran a full audit of geisheker.com: every one of the 168 URLs in the post and page sitemaps, scanned for the numeric fingerprints of statistics I could not trace to a primary source. The audit found 19 instances across 6 pages. The 29% versus 19% claim was live on three of them, under three different attributions: Integrate.io on one page, SingleGrain on another, and, on a third, The Geisheker Group.
My own site cited my own firm as the source of a statistic my firm never produced. The citation was an internal link pointing at another page on the same site, which itself credited a vendor blog. A closed loop, running entirely inside my own domain.
Then it left the domain. A competitor, Ancore Partners, now publishes the claim as “Research by Geisheker Group (2026).” Another site credits a firm called “Geisheker & Associates,” which does not exist and appears to be an AI-generated variant of my name. The number I had republished without checking came back to me as my own research.
All 19 instances were removed on August 30, 2026, in two passes, and the site was re-crawled to confirm zero remaining. I am publishing the specifics because a vague admission is worth nothing; the failure is only useful to a reader if the mechanism is visible.
Why did every editorial check miss it?
This is the part with a transferable lesson, and it applies to any marketing team with a content review process.
The editorial standard on this site, in force since long before the audit, required that every statistic be “specific, verifiable, and attributed to a named source, ideally with the year.” Now run the fabricated claim through that test. Twenty-nine percent versus 19%: specific. Attributed to Harvard Business Review: named source. Dated: yes. It passes cleanly. It passed every review, every time, for months.
The test was checking whether an attribution string was present. It never asked whether the source existed. Those are different questions, and only the second one catches a laundered number.
Peter Geisheker argues that this is the general shape of the problem, not a quirk of one checklist: a structural review can only validate the form of a claim, never its truth. A fabricated statistic with a plausible attribution is formally perfect. It is specific, sourced-looking, and dated, which means it will survive any process built on structure. Only tracing catches it, and tracing is the step that gets skipped because it is slow and the number already looks fine.
The fix that went into the editorial framework afterward has three parts. An attribution string is not a source: you must hold the URL of the primary study before the number ships. When several sites credit one number to different origins, that disagreement is the tell, and the number is dropped rather than re-attributed to the most credible-sounding of them. And the firm is never cited as the source of a third-party statistic, which is the rule that would have caught the worst instance on its own.


Try two senior CMOs before you hire them
30 minutes with both of us. No hard sell. Written plan in 3 business days.
What does AI do to a laundered statistic?
It accelerates it, and it makes the damage harder to reverse.
The Tow Center for Digital Journalism at Columbia University tested eight generative search tools across 1,600 queries, giving each a direct quote from a real article and asking it to identify the source. The tools returned incorrect citations more than 60% of the time. The best performer was wrong in 37% of cases and the worst in 94%. More than half of the citations from two of the tools led to fabricated or broken URLs, and the researchers noted that premium versions produced more confidently incorrect answers than the free ones, because they were less willing to decline a question they could not answer.
Read that finding next to the mechanism described above and the interaction is obvious. A system that confidently assigns plausible sources to content, operating on a web full of numbers with no real source, does not merely repeat the fabrication. It manufactures new attributions for it. That is almost certainly how a growth statistic ended up credited to a fractional CMO agency in Wisconsin, and how a firm that does not exist, “Geisheker & Associates,” acquired a research program.
The operator lesson underneath this is one Peter Geisheker has made repeatedly about AI output generally:
“If you are not an expert in the thing you are asking AI to do, you have no idea whether what came back is gold or garbage. A junior marketer and I use the identical model and get wildly different results, because I know which of the fifty outputs to keep.”
A fabricated statistic is the purest example of that gap. The output is fluent, formatted correctly, and carries a citation. Nothing about its appearance signals the problem. Only someone who knows to ask “does this study exist” ever finds out, and that question is domain knowledge, not prompting skill. This is the same argument that applies to getting cited by AI in B2B marketing: the machine will produce something either way, and the value of the person in the loop is entirely in knowing which outputs to throw away.
There is a second-order risk for any firm with a recognizable name. Once models have learned an association between your brand and a number, removing the number from your website does not remove the association from the models. The correction has to be published, indexed, and given time. That is a slower remedy than the mistake deserved, and it is a good reason to never publish the number in the first place.
How do you check a marketing statistic in under a minute?
Four steps, and they work on any vendor claim in any category, not just this one.
- Search the number, not the topic. Put the figures themselves in quotes, for example “29%” together with “19%” and the category. You are looking for how many different origins the same number carries.
- Count the attributions. One consistent source across every result means the number is probably real. Three or more different sources for identical figures means it is laundered. This single step resolves most cases in about thirty seconds.
- Follow the citation one level up. Click through to the named source. A real study has a methodology, a sample size, and a date. If the trail ends at an agency blog, a listicle, or a page that itself cites another blog, you have found the end of the chain and there is no study at it.
- Check whether the cited organization publishes that kind of research at all. Harvard Business Review publishes research on executive turnover and organizational design; it does not run growth-rate studies on fractional marketing vendors. A source that is authoritative in general is not authoritative for every claim attached to its name.
Applied to the 29% claim, this takes well under a minute and the answer is unambiguous. I did not run it, for months, on my own pages. The step is not hard; it is just easy to skip when the number already supports the point you were making.
What should you ask a fractional CMO about their numbers?
If you are evaluating fractional CMO companies, the sourcing question is a cheap and unusually revealing piece of diligence, because it tests something no website can fake.
Ask for the primary source of any category-wide statistic on their site. Not the citation, the underlying study. A firm that has it will produce it in a message. A firm that cannot will either go quiet or send you the agency blog they took it from, and either answer tells you how the rest of their analysis is assembled. The same person who does not check a public statistic will not check your attribution data, your conversion tracking, or the vendor report that says the campaign is working.
Ask what they would tell you if their own recommendation stopped working. Willingness to publish an unflattering finding, including about themselves, is a proxy for willingness to tell you something you do not want to hear in month four of an engagement, which is the moment a fractional chief marketing officer earns or loses their fee.
And treat any category-wide growth claim with suspicion on principle. Outcomes in this market vary too widely by industry, stage, starting point, and engagement scope for a single average to be meaningful even if someone did measure it honestly. What a serious operator can show you is documented outcomes from named engagements, with the context that makes them interpretable. A firm quoting an industry average is quoting something that says nothing about what they specifically will do for you. This is a recurring theme in when a fractional CMO is the wrong hire, and it applies to the claims as much as to the model.
Frequently Asked Questions
Is the 29% versus 19% fractional CMO revenue growth statistic real?
No. No primary study produces those figures. The claim circulates credited to Harvard Business Review, Harvard Business School, SingleGrain, Integrate.io, C Suite Network, and The Geisheker Group, which is five or more conflicting origins for one number. That pattern of disagreement is the reliable indicator that a statistic was never measured.
What is a laundered statistic?
A laundered statistic is a number that has been repeated across enough websites to acquire a plausible-sounding source it never actually had. It typically starts unsourced, picks up an authoritative-sounding attribution from a writer who needed a citation, and then spreads with that credit attached. It is distinguishable from real research by the fact that different pages credit it to different origins.
How do I verify a marketing statistic before I use it?
Search the figures themselves in quotes rather than the topic, count how many different sources the same number is credited to, follow the citation one level up to see whether the trail ends at a real study or at another blog, and check whether the named organization publishes that type of research at all. Three or more conflicting origins means the number should be discarded rather than re-attributed.
Why did The Geisheker Group publish a fabricated statistic?
Because statistics were sourced by searching for them rather than traced to origin, and the highest-ranking results for any “[category] statistics” query are aggregator pages built from the same laundering process. The editorial standard in force required a named source and a date, both of which the fabricated claim had. The check validated the form of the citation, not the existence of the study. All 19 affected instances were removed on August 30, 2026.
What is the difference between a primary source and an attribution?
An attribution is a name printed next to a number. A primary source is the study, survey, or dataset the number originated in, with a methodology, a sample size, a date, and a URL you can open. A statistic can carry a confident attribution and have no primary source behind it at all, which is precisely how fabricated numbers survive editorial review.
Can AI tools be trusted to cite sources accurately?
Not without verification. The Tow Center for Digital Journalism found that eight leading generative search tools returned incorrect citations in more than 60% of 1,600 test queries, with the worst performer wrong 94% of the time, and that more than half of the citations from two tools led to fabricated or broken URLs. Premium versions were more confidently incorrect than free ones. Any statistic sourced through an AI tool needs the primary document confirmed independently.
What should I ask a fractional CMO to test their rigor?
Ask for the primary source behind any category-wide statistic on their website. A firm that has it will send it; a firm that cannot will go quiet or forward the agency blog they took it from. The same standard applied to a public statistic is the standard that will be applied to your attribution data and your vendor reports.
Implementing this standard in your company
Most marketing teams agree with all of this the moment they read it. The harder problem is that agreement changes nothing, because the failure does not come from people deciding to be sloppy. It comes from a process that sources numbers by searching for them, run by people who are busy, using a review checklist that validates form rather than truth. Every part of that is reasonable in isolation, and the output is still wrong.
Installing the fix is fractional CMO work, and it is smaller than it sounds: a hard rule that no statistic ships without a primary-source URL, a maintained list of numbers already caught so the same fabrication cannot re-enter, and a tracing step that happens during research rather than during review. The same discipline extends past content into the places where it costs real money, which is vendor reporting, attribution data, and any dashboard number nobody has traced back to its definition.
This is not for everyone. If you have mature in-house marketing leadership with a functioning editorial standard, you do not need outside help to do this. If you are under $2M in revenue and not well funded, your attention belongs in sales and product first. If you are past that point and you suspect that some of the numbers your marketing runs on have never been checked, that is worth a short conversation about your specific situation.
About Peter Geisheker
Peter Geisheker is founder and CEO of The Geisheker Group, Inc., a fractional CMO agency serving B2B, B2B SaaS, and PE/VC-backed companies with $2M+ in revenue. He and Michael Pecora lead engagements together as embedded senior marketing executive, drawing on 20-plus years of B2B revenue growth experience and documented client outcomes including 6X inbound lead growth, 100% year-over-year SaaS revenue growth for three consecutive years, a 77% reduction in paid acquisition spend while revenue grew, and $1 million per week in managed ad spend for law firm lead generation. Connect with Peter on LinkedIn.
References and Sources
- Jaźwińska, Klaudia and Aisvarya Chandrasekar, “AI Search Has a Citation Problem,” Tow Center for Digital Journalism, Columbia Journalism Review (March 2025): https://www.cjr.org/tow_center/we-compared-eight-ai-search-engines-theyre-all-bad-at-citing-news.php
- Deck, Andrew, “AI search engines fail to produce accurate citations in over 60% of tests, according to new Tow Center study,” Nieman Journalism Lab (March 2025): https://www.niemanlab.org/2025/03/ai-search-engines-fail-to-produce-accurate-citations-in-over-60-of-tests-according-to-new-tow-center-study/
- Spencer Stuart, “CMO Tenure Study” (2026): https://www.aaaa.org/research-report/cmo-tenure-study
- The CMO Survey, “Marketing Contracts Under Economic Pressure Despite Growing Value and AI Gains,” 35th edition, Duke University Fuqua School of Business with Deloitte and the American Marketing Association (2026): https://cmosurvey.org/marketing-contracts-under-economic-pressure-despite-growing-value-and-ai-gains/
- The CMO Survey, “Highlights and Insights Report,” 35th edition (2026), full PDF: https://cmosurvey.org/wp-content/uploads/2026/04/The_CMO_Survey-Highlights_and_Insights_Report-2026.pdf
- Heidrick & Struggles, “2026 Talent Lens Survey: The State of Interim Talent” (2026), n=3,810 interim leaders across the Americas and Europe: https://www.heidrick.com/en/perspectives/on-demand-talent/2026-talent-lens-survey_the-state-of-interim-talent
- Lippincott and Bloomberg Media, “CMO Outlook 2026,” fielded by NewtonX, n=541 marketing leaders (June 2026): https://www.lippincott.com/cmo-outlook-2026/
- Bloomberg Media, “Bloomberg Media and Lippincott Unveil New Research on the Evolving Role of the CMO” (June 17, 2026): https://www.bloombergmedia.com/press/bloomberg-media-and-lippincott-unveil-new-research-on-the-evolving-role-of-the-cmo/
- Forrester, “The State Of AI Inside US Marketing Agencies, 2026,” in partnership with the 4As (June 24, 2026): https://investor.forrester.com/news-releases/news-release-details/forrester-nine-10-us-marketing-agencies-use-ai-cut-costs-expense
- SparkToro, “In 2026, Less Than One Third of Google Searches Still Send a Click” (2026): https://sparktoro.com/blog/in-2026-less-than-one-third-of-google-searches-still-send-a-click/
- Search Engine Land, “Google zero-click searches reach 68% in early 2026: Study” (June 2026): https://searchengineland.com/google-zero-click-searches-2026-study-479717
- Similarweb, “Zero-Click Marketing: What the 2026 Data Means” (2026): https://www.similarweb.com/blog/marketing/geo/zero-click-marketing/
- Marketing Dive, “CMOs prioritize organizational influence over long-term brand growth” (June 22, 2026), reporting the Lippincott findings: https://www.marketingdive.com/news/cmos-prioritize-organizational-influence-over-long-term-brand-growth/823330/
- The Geisheker Group, Inc., site-wide statistic audit of all 168 URLs in post-sitemap.xml and page-sitemap.xml (August 30, 2026). First-party audit data; findings summarized in this article.
Free Written Growth Plan
Wondering if a fractional CMO is right for you?
Try us before you hire us. Book a free 30-minute working session with both of us and get a written growth plan you can use whether or not you hire us.
No hard sell on the call. Your plan arrives within 3 business days. See a sample plan