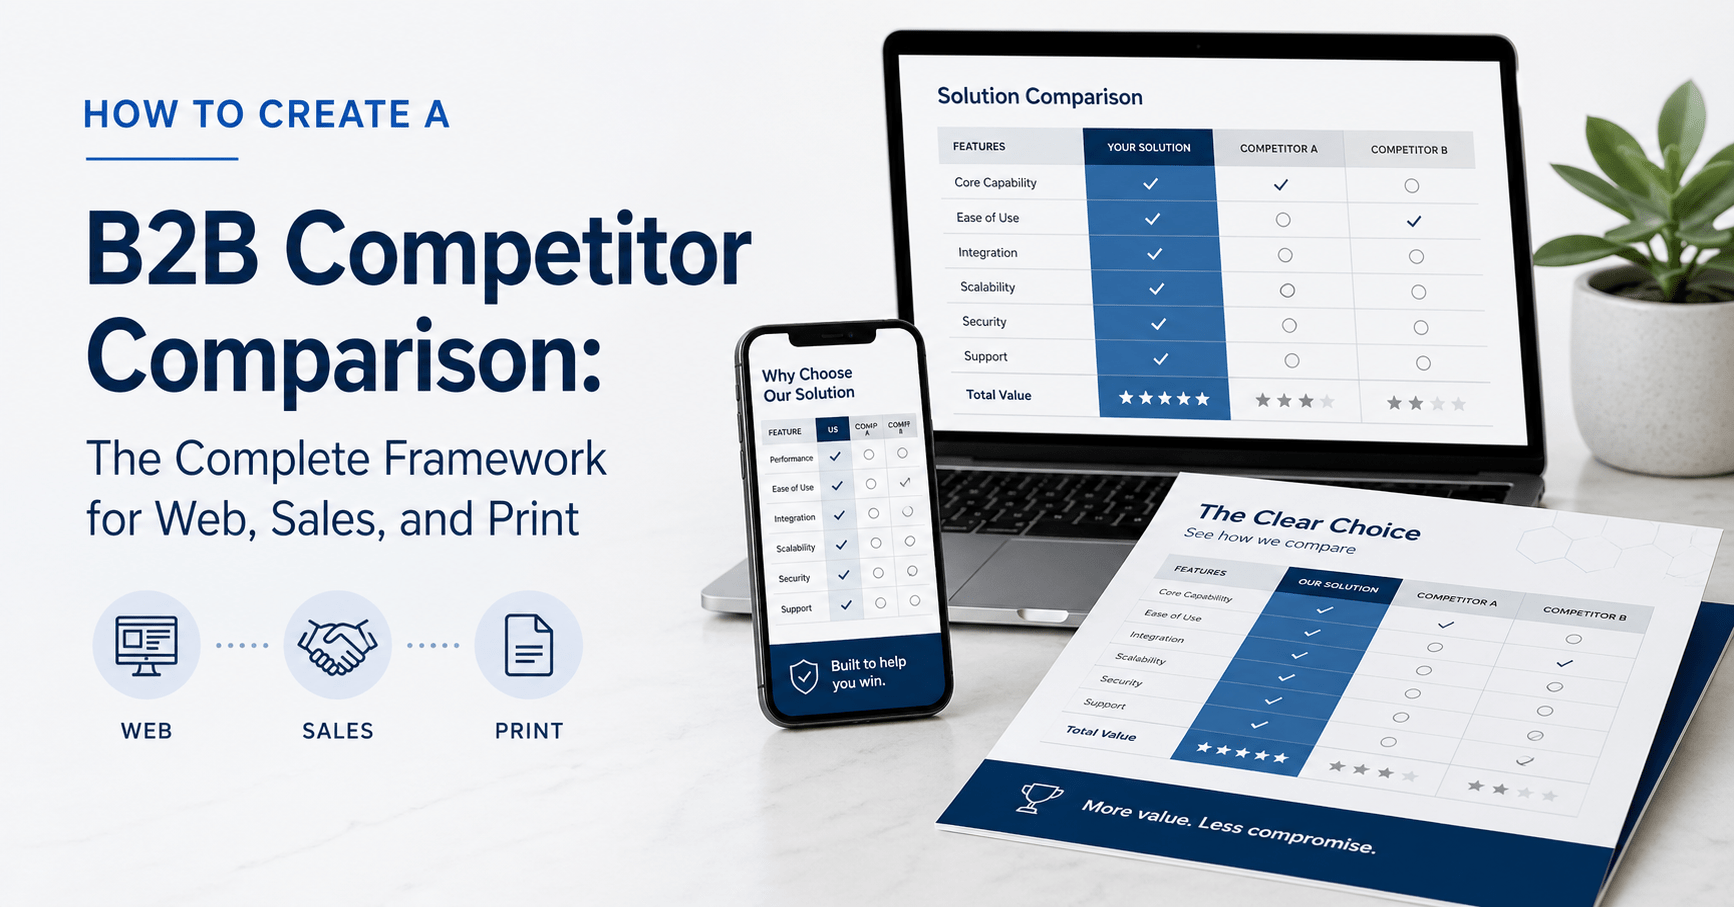
Learning how to create a B2B competitor comparison means building an honest, side-by-side view of how your offering stacks up against named alternatives across the criteria buyers actually use to decide. The strongest comparisons live in two places: as a web page that ranks for “vs” and “alternatives” searches, and as sales collateral (one-pagers and brochures) that closes the loop in person. Buyers favor a vendor before formal evaluation begins, so the goal is to confirm that preference, not create it from scratch.
Key Facts at a Glance
- According to 6sense’s 2025 Buyer Experience Report, 95% of winning B2B vendors are already on the buyer’s “Day One” shortlist before any sales contact occurs (6sense, 2025).
- B2B buyers now evaluate an average of 5.1 vendors per purchase, with prior experience of nearly four of them (6sense, 2025).
- 94% of B2B buying groups rank their shortlist vendors by preference before contacting any of them, and the pre-contact favorite wins approximately 80% of the time (6sense, 2025).
- 41% of B2B buyers already favor one vendor before formal evaluation begins, per Forrester research summarized by Directive (Directive, 2026).
- 52% of B2B buyers trust software comparison websites when shortlisting brands; comparison sites rank as the most-trusted source overall (The Insight Collective, 2025).
- Comparison and review pages convert at roughly 2 to 5 times the rate of general blog content; comparison searches typically convert at 5% to 10% versus 1% to 2% for general organic traffic (Genesys Growth, 2026; Averi, 2026).
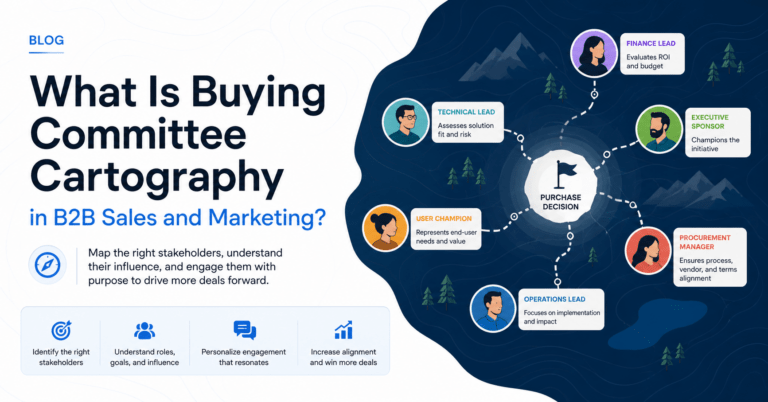
- A typical B2B purchase now involves 13 internal stakeholders and 9 external influencers, per Forrester’s 2026 data (Wave Connect, 2026).
- 90% of B2B buyers conduct independent research before ever speaking with a vendor, according to Responsive’s 2025 Inside the Buyer’s Mind report (Responsive, 2025).
Most B2B teams treat the question of how to create a B2B competitor comparison as a content-marketing exercise. They publish a “vs” page, drop a feature checklist, and call it done. That is a mistake. A B2B competitor comparison is a strategic asset that has to perform in three places at once: as an SEO-driven web page, as a printed brochure or trade-show one-sheet, and as a sales-room one-pager that a rep can hand a buying committee on the spot. The behavioral data is unambiguous: as I detailed in our breakdown of how AI has changed the B2B buying process, most evaluation now happens before a single sales call.
This article walks through The Side-by-Side Authority Framework, a five-stage methodology for building competitor comparisons for B2B clients. You will also get a clear breakdown of where comparisons differ from battlecards (a frequent and costly confusion), and field-tested guidance for the web, brochure, and one-pager formats.
In this article:
- Why B2B competitor comparisons matter more in 2026 than ever before
- Comparison vs. battlecard: the critical distinction
- The Side-by-Side Authority Framework
- How to build a B2B competitor comparison page for your website
- Format selection: web vs. brochure vs. one-pager
- How to create a sales one-pager competitor comparison
- How to design a competitor comparison brochure that prospects keep
- What to include in any B2B competitor comparison
- The most common B2B competitor comparison mistakes
- How often to update your competitor comparisons
- FAQ
Why Do B2B Competitor Comparisons Matter More in 2026?
Because the buyer arrives at the table with their decision mostly made. The 2025 6sense Buyer Experience Report, which surveyed nearly 4,000 B2B buyers globally, found that 95% of winning vendors were on the buyer’s Day One shortlist, and that 94% of buying groups ranked their shortlist by preference before any sales contact (6sense, 2025). The pre-contact favorite goes on to win the deal about 80% of the time.
That single dataset rewires the job of a competitor comparison. The comparison is not where you persuade a prospect from scratch. It is where you confirm a leaning prospect’s instinct, displace a competitor who got the early nod, or surface to a procurement reviewer who is auditing the shortlist for risk. According to Responsive’s 2025 buyer survey, 90% of B2B buyers conduct independent research before contacting any vendor; if your comparison content does not exist where that research is happening, the conversation has already moved past you (Responsive, 2025). For a broader strategic context on how comparisons fit alongside positioning, ICP definition, and channel selection, refer to our B2B marketing strategy framework.
The economics confirm the strategic case. Comparison and review pages convert at roughly 2 to 5 times the rate of general blog content, and comparison-intent search traffic converts at 5% to 10% versus 1% to 2% for general organic (Averi, 2026). Few other content investments compete with that ratio.
What Is the Difference Between a Comparison and a Battlecard?
A B2B competitor comparison is customer-facing. A battlecard is internal. That distinction is the single most important rule in this entire workflow, and B2B teams break it constantly.
A comparison is something a prospect reads on your website, pulls from a brochure at a trade show, or receives as a one-pager from a sales rep. It is calibrated for honesty, balance, and credibility because the buyer can fact-check every claim against G2, Reddit, peer references, and a generative AI tool in under sixty seconds. A battlecard, by contrast, is a sales enablement document that arms reps with talking points, rebuttals, landmines, and competitor weaknesses. Battlecards can be aggressive; comparisons cannot. As Dock notes in their archive of curated B2B sales assets, “A battlecard is never customer-facing. If the content is meant to be shared with prospects, it’s no longer a battlecard. That would typically be called a competitor comparison” (Dock, 2026).
When teams blur the line, they ship comparisons that read as biased attack pieces. Buyers detect the bias instantly and lose trust, which is the opposite of what the comparison was supposed to produce.
The Side-by-Side Authority Framework
Most B2B competitor comparisons fail at the strategy layer, not the production layer. The Side-by-Side Authority Framework is a five-stage methodology for making strategy decisions before any design or copywriting work begins.
Stage 1: Source. Identify which competitors actually appear on shortlists alongside you. Pull the data from win/loss interviews, sales call recordings (Gong or Chorus), CRM closed-lost reasons, and Google Search Console queries containing “vs” and “alternatives.” Most B2B companies build comparisons against the wrong rivals, the ones leadership thinks about, rather than the ones buyers actually weigh. Per Forrester, 86% of B2B purchases stall during the buying process; sourcing the wrong rivals adds friction that worsens that statistic.
Stage 2: Stack. Choose the comparison dimensions that matter to the buyer, not the ones that flatter you. Use voice-of-customer research, G2/Capterra review tags, and your sales discovery questions to identify the five to eight criteria buying committees evaluate first. Forrester’s 2026 data puts the typical B2B buying group at 13 internal stakeholders and 9 external influencers; each has different evaluation priorities, and the strongest comparisons cover criteria from at least three of those personas (Wave Connect, 2026).
Stage 3: State. Write the comparison honestly, including the criteria where competitors win or are equivalent. Honesty is a conversion strategy. Genesys Growth, summarizing 45-plus B2B SaaS engagements, observes that “the companies that win comparison searches are the ones that lead with positioning clarity, not feature volume” (Genesys Growth, 2026). Acknowledging where a competitor genuinely leads makes the rest of the comparison credible. Hiding it makes the entire piece feel like a sales pitch and trains buyers to discount your other claims.
Stage 4: Shape. Format the same comparison for three channels: a web page (for SEO and self-serve evaluation), a one-pager (for hand-off in sales conversations), and a brochure section (for trade shows and printed sales kits). The strategic content stays constant across formats; the layout, depth, and call-to-action change. Single-format comparisons leave demand on the table because B2B buyers consume content across at least three channels before purchasing.
Stage 5: Sustain. Set a quarterly review cycle. Competitor pricing, packaging, positioning, and feature claims shift constantly; an outdated comparison is worse than no comparison at all because it actively misleads buyers and undermines your credibility on first inspection.
These five stages produce comparisons that work simultaneously as marketing assets, sales tools, and SEO infrastructure.
How Do You Build a B2B Competitor Comparison Page for Your Website?
A B2B competitor comparison page is structured around the high-intent search query that brought the visitor in (typically “Your Brand vs Competitor” or “Competitor Alternatives”). The page must answer that query directly, completely, and honestly within the first scroll, then expand with depth for buyers who want it.
The recommended structure is consistent across high-performing examples: a one-sentence positioning statement at the top, a side-by-side comparison table covering five to eight buyer-defined criteria, a section for each major dimension explaining the trade-off, social proof (case studies or third-party reviews), an FAQ block, and a clear next-step call-to-action that matches the buying stage. Powered By Search recommends housing all comparison pages in a /compare/ subfolder and linking to them from the footer, which improves crawl efficiency and signals topical authority to Google (Powered By Search, 2026). Pages should target both word orders (“Your Brand vs Competitor” and “Competitor vs Your Brand”) because buyers search both ways.
Length should match buyer intent. Surface-level pages of under 800 words rarely rank; the strongest comparison pages typically run 1,500 to 3,000 words, with depth sections, FAQs, and proof points pulled into a single resource. The goal is to be the definitive answer, not just an entry in the search results.
Web vs. Brochure vs. One-Pager: When to Use Each Format
A B2B competitor comparison is not one asset. It is one strategic position rendered across three formats, each with a different job. The table below summarizes when to deploy each.
| Format | Primary Job | Distribution | Length / Density | Best For |
|---|---|---|---|---|
| Web comparison page | Capture high-intent search traffic; convert self-directed buyers | Organic search, footer link, sales follow-up email | 1,500 to 3,000 words; full feature table; FAQ; case studies | Buyers in independent research mode; buying committee members validating a champion’s recommendation |
| Sales one-pager | Equip a rep to win in a live conversation; leave-behind during a meeting | Email after demo; printed leave-behind; digital sales room | One page, front and back; headline differentiator + 5 to 7 row table + 1 proof point + clear CTA | Mid-funnel deals where the buyer has met you and a competitor |
| Brochure (with comparison section) | Build category authority and trust; introduce comparison context inside the broader story | Trade shows, conferences, executive briefings, direct mail | 6 to 12 pages; comparison occupies one to two interior spreads | High-ACV deals; complex enterprise sales; relationship-driven industries (manufacturing, professional services, regulated B2B) |
The strategic content (the criteria evaluated, the positions taken, the proof offered) stays constant across all three formats. What changes is the layout density, the audience’s reading mode, and the call-to-action. The web page asks for a demo; the one-pager reinforces a pending decision; the brochure builds the brand association before the buyer is even in active evaluation.
How Do You Create a Sales One-Pager Competitor Comparison?
The sales one-pager is the most underused format in B2B because most marketing teams either skip it or hand the sales team a customer-facing battlecard by mistake. A well-built one-pager closes deals that the web page started.
The structure is tight: a single-sentence positioning statement at the top, a five-to-seven-row comparison table covering the criteria the buyer named in discovery, one strong proof point (a customer logo, an outcome statistic, or a third-party review excerpt), an “honest acknowledgment” line conceding where the competitor genuinely wins or matches, and a single call-to-action that matches the buying stage (typically “schedule a working session” rather than “book a demo,” because the prospect has already taken the demo). Visme’s analysis of high-performing sales one-pagers finds that conciseness wins; reps and buyers alike abandon documents that try to communicate everything at once (Visme, 2026).
Format the one-pager front and back of a single sheet. Use the front for the comparison; use the back for the proof and the next step. Print is acceptable; PDF distributed via email is now more common; digital sales rooms (Dock, Highspot, Mindtickle) are emerging as the preferred delivery channel for enterprise B2B.
How Do You Design a Brochure With a Competitor Comparison Section?
A brochure-based competitor comparison serves a different purpose than the web or one-pager versions. It is positioned inside a longer brand and category narrative, which means it carries more credibility because it is not the entire pitch.
The recommended structure for a B2B services or B2B SaaS brochure is six to twelve pages, with the comparison occupying one to two interior spreads roughly 60% of the way through the document. The flow proceeds as: cover (positioning statement and visual identity), category context (why this problem matters), your approach (the unique methodology), proof (case studies and outcome data), comparison spread (the side-by-side), pricing or engagement model, and a clear next step. The comparison section should follow the same rules as the web and one-pager versions: honest, buyer-defined criteria, acknowledgment of competitor strengths, and proof points that back every claim.
For trade-show, executive-briefing, or direct-mail deployment, brochures still outperform digital alternatives in industries where buying committees include older decision-makers, where confidentiality concerns make digital sharing risky, or where the in-person experience anchors brand perception. A printed brochure that arrives with a personalized cover letter remains one of the highest-conversion outbound assets in regulated B2B and high-ACV professional services.
What Should a B2B Competitor Comparison Include?
Every effective B2B competitor comparison, regardless of format, includes seven elements:
- A clear positioning statement that names the buyer profile you serve best (one or two sentences at the top).
- A criteria table with five to eight buyer-defined evaluation dimensions, not vendor-defined feature lists.
- Side-by-side data for each criterion across all compared vendors, using consistent units and definitions.
- Honest acknowledgment of criteria where competitors lead or match. This is the single highest-trust signal in a comparison and the biggest differentiator from a battlecard.
- Proof points for the criteria where you lead, including customer logos, third-party reviews, outcome data, or analyst recognition.
- A direct answer to the most common objection, typically pricing, integration, or onboarding.
- A specific call-to-action matched to the buying stage (free consultation, working session, demo, ROI calculator).
Comparisons that omit any of these seven elements underperform. The most common omissions are honest acknowledgment (which kills credibility) and buyer-defined criteria (which produces feature lists no buyer cares about).
What Are the Most Common B2B Competitor Comparison Mistakes?
Six mistakes appear in nearly every underperforming comparison I review for clients, and most of them are strategy errors disguised as production errors.
The first is comparing against the wrong competitors, the ones leadership feels threatened by rather than the ones buyers actually shortlist with you. The second is choosing self-serving criteria, building a comparison around the features you ship rather than the criteria buyers prioritize. The third is dishonest framing, hiding where competitors lead or using selective screenshots; buyers detect this in seconds and lose trust permanently. The fourth is publishing once and abandoning it; comparisons must be refreshed at least quarterly to stay accurate. The fifth is treating the web page as the only output and ignoring the sales-room and brochure formats; this leaves 60% of the comparison’s potential value on the table. The sixth, and the most damaging in B2B services and consulting, is naming competitors where the legal or relationship risk outweighs the marketing benefit; some industries call for category-level comparisons (us vs. “traditional firms,” “agencies,” “in-house teams”) rather than head-to-head named comparisons.
Avoiding these six failure modes accounts for most of the variance between high-converting and low-converting B2B comparisons.
How Often Should You Update a B2B Competitor Comparison?
Quarterly at minimum, with an additional update triggered any time a competitor materially changes pricing, packaging, positioning, or makes a public claim that contradicts something in your comparison. Genesys Growth’s analysis of comparison-page maintenance recommends the same quarterly cycle and notes that “in fast-moving categories, quarterly review cycles may be sensible” while major events should drive immediate updates (Genesys Growth, 2026).
The discipline matters more than the cadence. An outdated comparison harms credibility more than no comparison does, because the buyer fact-checks one row, finds it wrong, and discounts every other claim on the page. A practical maintenance system assigns one product marketer or Fractional CMO advisor as the comparison owner, sets a recurring quarterly review meeting on the calendar, and ties the review to a documented checklist of competitor data points (pricing, feature parity, positioning headline, any major analyst report). Most B2B companies overproduce comparisons and underinvest in maintenance; the leaders do the opposite.
Frequently Asked Questions
What should be included in a B2B competitor comparison?
A B2B competitor comparison should include seven elements: a positioning statement, a criteria table built around buyer-defined dimensions, side-by-side data with consistent units, honest acknowledgment of where competitors lead, proof points (case studies, third-party reviews, analyst data), a direct answer to the most common buying objection, and a specific call-to-action matched to the buying stage. Powered By Search’s analysis of high-converting comparison pages confirms these elements as a near-universal pattern across B2B SaaS leaders (Powered By Search, 2026).
How do you compare two competitors in B2B?
Start by sourcing the competitor list from win/loss data and Search Console queries, not leadership opinion. Choose five to eight evaluation criteria using voice-of-customer research and G2 review tags. Document each competitor’s position on each criterion using public sources (their website, G2, Capterra, analyst reports) and primary research (customer interviews, sales call recordings). Format the result as a side-by-side table, then add narrative sections explaining the trade-off behind each row. The Side-by-Side Authority Framework in this article details the full five-stage process.
What is the difference between a battlecard and a comparison page?
A comparison page or one-pager is customer-facing and calibrated for honesty, balance, and credibility. A battlecard is internal sales enablement, calibrated for speed of recall during a competitive call. Battlecards can name landmines, weaknesses, and aggressive talking points; comparisons cannot. Treating one as the other is the most common categorization error in B2B competitive content. Dock’s archive of B2B sales assets articulates this distinction directly (Dock, 2026).
How long should a B2B comparison page be?
The strongest B2B comparison pages typically run 1,500 to 3,000 words, with a comparison table inside the first scroll, narrative sections explaining each row, social proof, and an FAQ block. Pages under 800 words rarely rank for “vs” and “alternatives” queries because they cannot demonstrate the depth Google rewards for high-intent commercial searches. The exact length should match buyer intent, not an arbitrary word count target.
Should B2B companies name competitors in marketing materials?
In SaaS, named comparisons are standard and expected; in B2B services and consulting, the answer depends on industry norms, legal exposure, and relationship risk. When direct naming creates legal or relationship friction, category-level comparisons (us vs. “traditional firms,” “agencies,” “in-house teams”) deliver most of the marketing benefit without the friction. Test the approach with your sales leadership and legal team before publishing.
How often should I update my comparison page?
Quarterly at minimum, with immediate updates whenever a competitor materially changes pricing, packaging, positioning, or makes a public claim that contradicts something in your comparison. The risk of outdated comparisons is asymmetric; one wrong row trains buyers to discount the whole page.
Where should the comparison live on the website?
In a dedicated /compare/ subfolder, with each comparison housed as its own page (yourbrand.com/compare/competitor-name). Link to the subfolder from the website footer, and from related blog and pricing content. This structure improves crawl efficiency, signals topical authority to Google, and makes it easy for buyers to find the full set of comparisons in one place.
What if my industry has too many competitors to cover?
Build comparisons against the top three to five competitors that appear on actual buyer shortlists, then add an “alternatives” page that surveys the broader category. Most B2B companies overestimate how many comparisons they need; quality matters far more than quantity, and five thorough, honest comparisons outperform twenty shallow ones.
Conclusion: The Comparison Is the Sale
Building a B2B competitor comparison is no longer optional for any B2B company that sells against named alternatives. The 6sense data is clear: 95% of winning vendors are on the buyer’s Day One shortlist, the pre-contact favorite wins about 80% of deals, and 90% of buyers conduct independent research before any vendor contact (6sense, 2025; Responsive, 2025). If your comparison content does not exist where that research happens, you are not in the conversation when the decision gets made.
The Side-by-Side Authority Framework exists to make sure your comparison content does the strategic work, not just the production work. Source the right competitors, stack the right criteria, state the position honestly, shape the asset for each channel, and sustain the content quarterly. The framework applies equally to a B2B SaaS company building twenty comparison pages and a professional services firm building a single executive brochure spread; the principles do not change with format.
The most common reason B2B companies fail to build effective competitor comparisons is not lack of data or lack of design talent. It is the absence of senior marketing leadership willing to make the strategic calls (which competitors, which criteria, what to acknowledge, how to format) before the production work begins. That is precisely the gap a Fractional CMO closes.
If you are evaluating how your current competitive positioning shows up across your website, sales collateral, and printed materials, schedule a free consultation to walk through where your comparisons are leaving pipeline on the table.
About Peter Geisheker
Peter Geisheker is the Founder and CEO of The Geisheker Group, Inc., a Fractional CMO and B2B marketing advisory serving CEOs and investor-backed companies. He specializes in scalable, capital-efficient revenue systems across B2B SaaS, B2B services, and performance-driven environments, with AI embedded across all engagements. His work includes programs delivering 6X inbound lead growth, 100% YoY SaaS revenue growth for three consecutive years, and a 77% reduction in paid acquisition spend while growing revenue.
Ready to explore how a Fractional CMO can accelerate your growth? Schedule a free consultation with Peter.
References and Sources
- 6sense. “The B2B Buyer Experience Report for 2025.” https://6sense.com/science-of-b2b/buyer-experience-report-2025/
- Forrester data summarized in: Directive. “8 B2B Lead Generation Benchmarks To Watch in 2026.” https://directiveconsulting.com/blog/blog-b2b-lead-generation-statistics/
- Forrester data summarized in: Wave Connect. “B2B Sales Statistics 2026: 65+ Facts and Data.” https://wavecnct.com/blogs/b2b-sales-statistics
- Responsive. “2025 B2B Buyer Report: What Really Drives Decisions.” https://www.responsive.io/blog/2025-b2b-buyer-decisions-report
- The Insight Collective. “B2B Tech Buying Behavior 2025: 120+ Key Insights & Trends.” https://www.theinsightcollective.com/insights/b2b-tech-buyer-behavior-stats
- Genesys Growth. “Best Practices for Designing Competitive Comparison Pages.” https://genesysgrowth.com/blog/designing-competitive-comparison-pages
- Averi. “How to Build Comparison Pages That Actually Win.” https://www.averi.ai/how-to/how-to-build-comparison-pages-that-actually-win-(against-competitors-with-100x-your-traffic)
- Powered By Search. “10 Best Examples of Competitor Comparison Landing Pages.” https://www.poweredbysearch.com/learn/best-saas-comparison-pages/
- Powered By Search. “Competitor Comparison Landing Pages: A Strategic Approach for B2B SaaS.” https://www.poweredbysearch.com/blog/competitor-comparison-landing-pages-for-saas/
- Dock. “The 24 Best Sales Battlecard Examples We Could Find.” https://www.dock.us/library/sales-battlecard-examples
- Crayon. “Sales Battlecards 101: The Ultimate Guide.” https://www.crayon.co/blog/competitive-battlecards-101
- Visme. “13 Winning Sales Battlecard Templates & Best Practices.” https://visme.co/blog/sales-battlecard-templates/
- Backstage SEO. “B2B SaaS comparison pages: The complete guide for 2026.” https://backstageseo.com/blog/b2b-comparison-pages/
- Productive Shop. “Competitor comparison landing pages: The goldmine of B2B SEO?” https://productiveshop.com/competitor-comparison-landing-pages-the-goldmine-of-b2b-seo/
- Prospeo. “B2B Buyer Journey Statistics for 2026.” https://prospeo.io/s/b2b-buyer-journey-statistics